Mapping data flows in Azure Data Factory
What are mapping data flows?
Mapping data flows are visually designed data transformations in Azure Data Factory. Data flows allow data engineers to develop data transformation logic without writing code. The resulting data flows are executed as activities within Azure Data Factory pipelines that use scaled-out Apache Spark clusters. Data flow activities can be operationalized using existing Azure Data Factory scheduling, control, flow, and monitoring capabilities.
Mapping data flows provide an entirely visual experience with no coding required. Your data flows run on ADF-managed execution clusters for scaled-out data processing. Azure Data Factory handles all the code translation, path optimization, and execution of your data flow jobs.
Getting started:
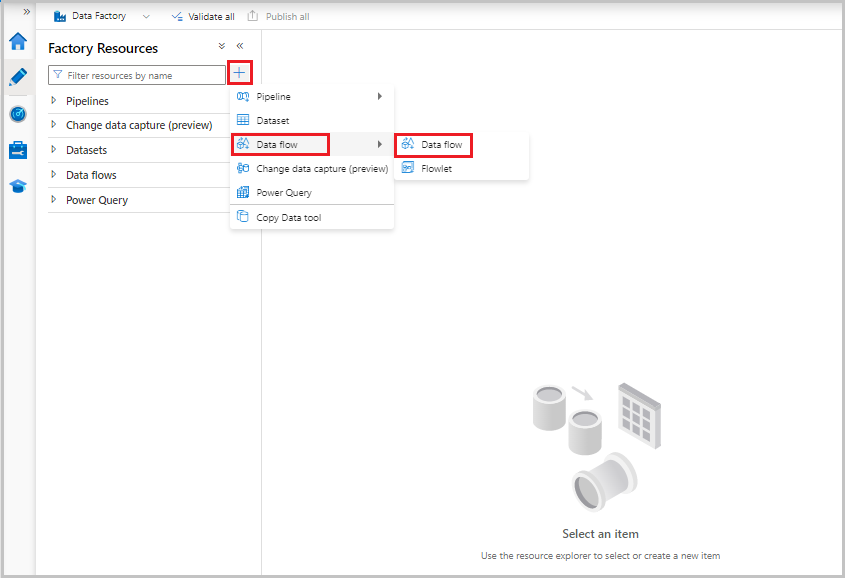
Data flows are created from the factory resources pane like pipelines and datasets. To create a data flow, select the plus sign next to Factory Resources, and then select Data Flow.
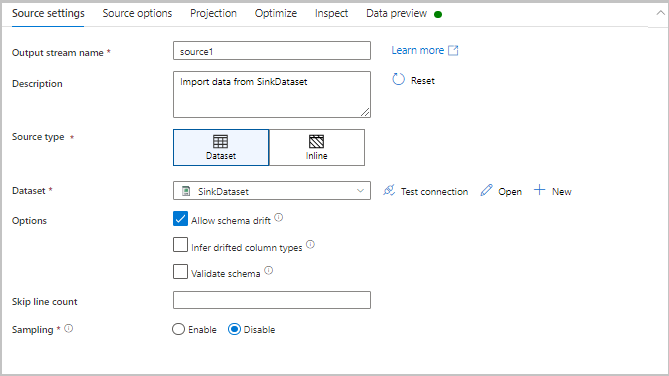
This action takes you to the data flow canvas, where you can create your transformation logic. Select Add source to start configuring your source transformation.
Authoring data flows
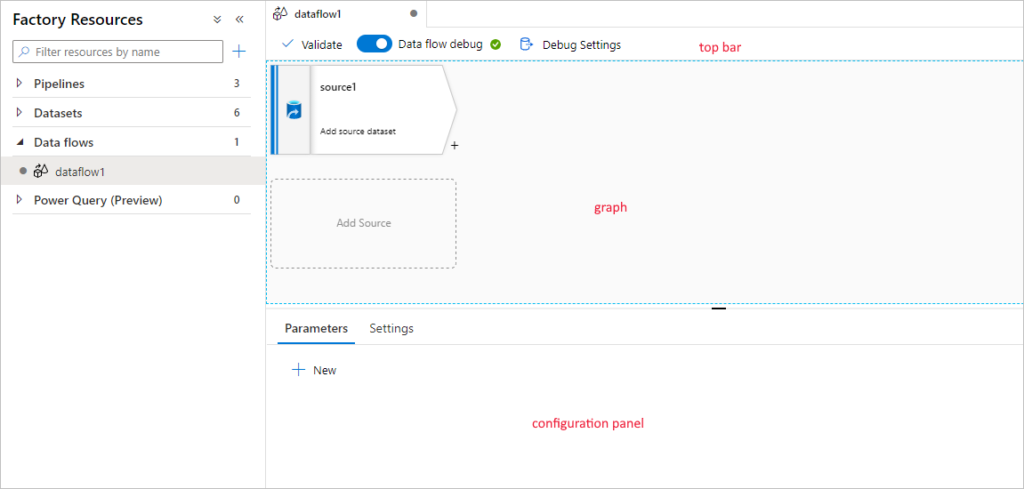
Mapping data flow has a unique authoring canvas designed to make building transformation logic easy. The data flow canvas is separated into three parts: the top bar, the graph, and the configuration panel.
Graph
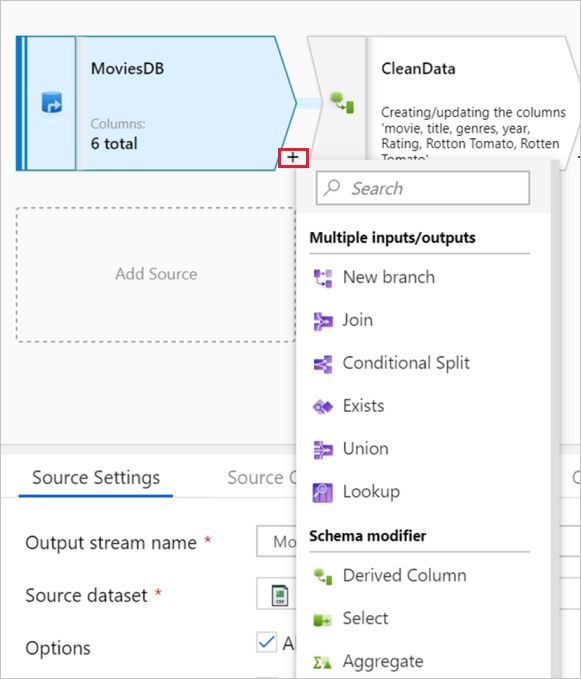
The graph displays the transformation stream. It shows the lineage of source data as it flows into one or more sinks. To add a new source, select Add source. To add a new transformation, select the plus sign on the lower right of an existing transformation.
Configuration panel
The configuration panel shows the settings specific to the currently selected transformation. If no transformation is selected, it shows the data flow. In the overall data flow configuration, you can add parameters via the Parameters tab.
Each transformation contains at least four configuration tabs.
Transformation settings
The first tab in each transformation’s configuration pane contains the settings specific to that transformation. For more information, see that transformation’s documentation page.
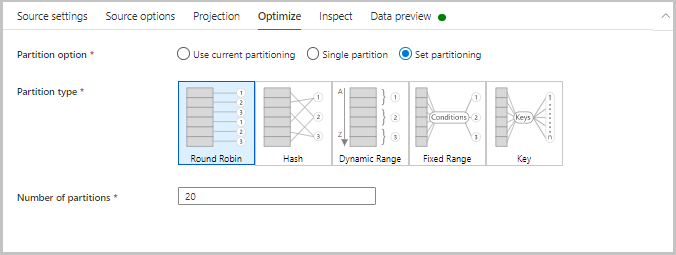
Optimize
The Optimize tab contains settings to configure partitioning schemes. To learn more about how to optimize your data flows.
Inspect
The Inspect tab provides a view into the metadata of the data stream that you’re transforming. You can see column counts, the columns changed, the columns added, data types, the column order, and column references. Inspect is a read-only view of your metadata. You don’t need to have debug mode enabled to see metadata in the Inspect pane.
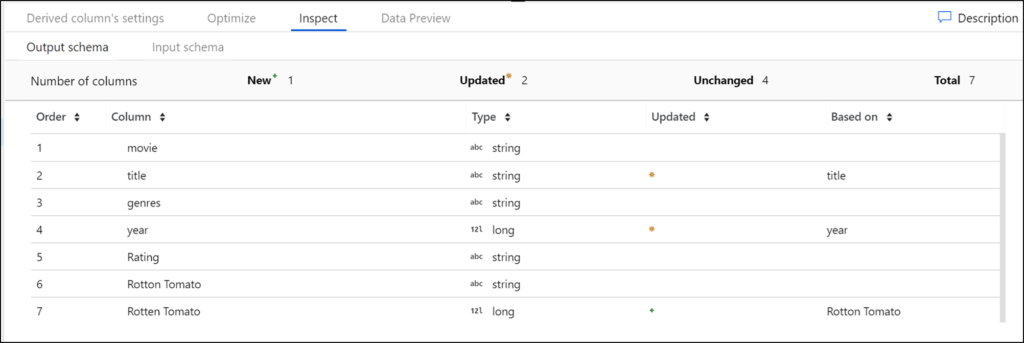
As you change the shape of your data through transformations, you’ll see the metadata changes flow in the Inspect pane. If there isn’t a defined schema in your source transformation, then metadata won’t be visible in the Inspect pane. Lack of metadata is common in schema drift scenarios.
Data preview
If debug mode is on, the Data Preview tab gives you an interactive snapshot of the data at each transform. For more information.
Debug mode
Debug mode allows you to interactively see the results of each transformation step while you build and debug your data flows. The debug session can be used both in when building your data flow logic and running pipeline debug runs with data flow activities.
Leave a Reply