Transform data using mapping data flows
In this post, we’ll use the Azure Data Factory user interface (UX) to create a pipeline that copies and transforms data from an Azure Data Lake Storage (ADLS) Gen2 source to an ADLS Gen2 sink using mapping data flow. The configuration pattern in this tutorial can be expanded upon when transforming data using mapping data flow.
In this post, will do the following steps:
- Create a data factory.
- Create a pipeline with a Data Flow activity.
- Build a mapping data flow with four transformations.
- Test run the pipeline.
- Monitor a Data Flow activity
Prerequisites
- Azure subscription. If you don’t have an Azure subscription, create a free Azure account before you begin.
- Azure storage account. You use ADLS storage as a source and sink data stores.
Create a data factory
In this step, you create a data factory and open the Data Factory UX to create a pipeline in the data factory.
- Open Microsoft Edge or Google Chrome. Currently, Data Factory UI is supported only in the Microsoft Edge and Google Chrome web browsers.
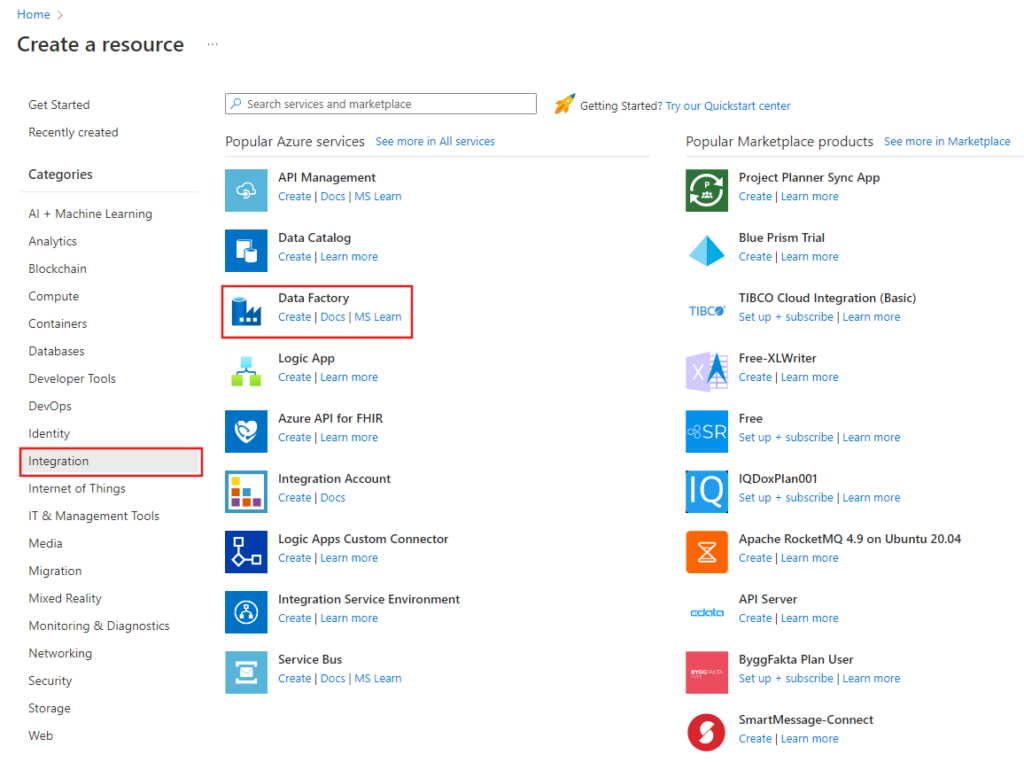
- On the left menu, select Create a resource > Integration > Data Factory:
3. On the New data factory page, under Name, enter ADFTutorialDataFactory.
The name of the Azure data factory must be globally unique. If you receive an error message about the name value, enter a different name for the data factory. (for example, yournameADFTutorialDataFactory).
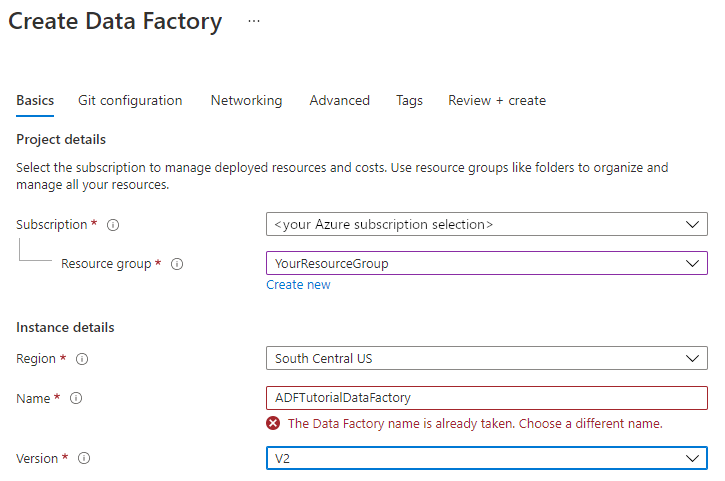
4. Select the Azure subscription in which you want to create the data factory.
5. For Resource Group, take one of the following steps:
a. Select Use existing, and select an existing resource group from the drop-down list.
b. Select Create new, and enter the name of a resource group.
6. Under Version, select V2.
7. Under Location, select a location for the data factory. Only locations that are supported are displayed in the drop-down list. Data stores (for example, Azure Storage and SQL Database) and computes (for example, Azure HDInsight) used by the data factory can be in other regions.
8. Select Create.
9. After the creation is finished, you see the notice in Notifications center. Select Go to resource to navigate to the Data factory page.
10. Select Author & Monitor to launch the Data Factory UI in a separate tab.
Create a pipeline with a Data Flow activity
In this step, you’ll create a pipeline that contains a Data Flow activity.
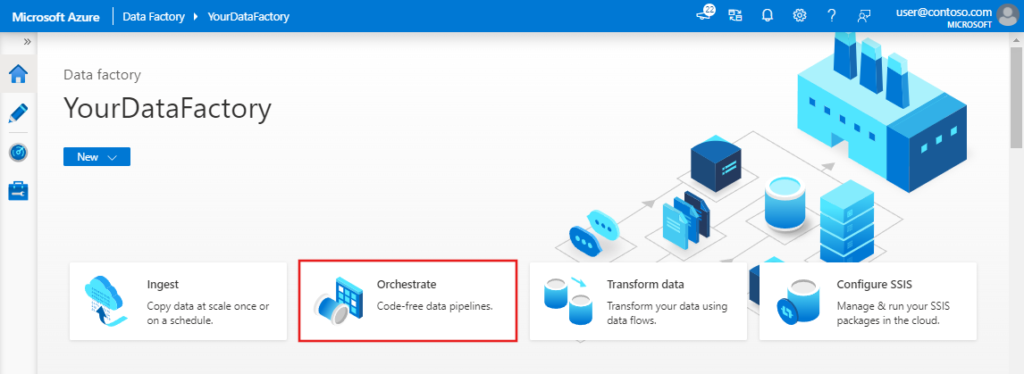
- On the home page of Azure Data Factory, select Orchestrate.
2. In the General tab for the pipeline, enter TransformMovies for Name of the pipeline.
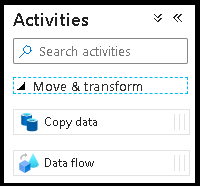
3. In the Activities pane, expand the Move and Transform accordion. Drag and drop the Data Flow activity from the pane to the pipeline canvas.
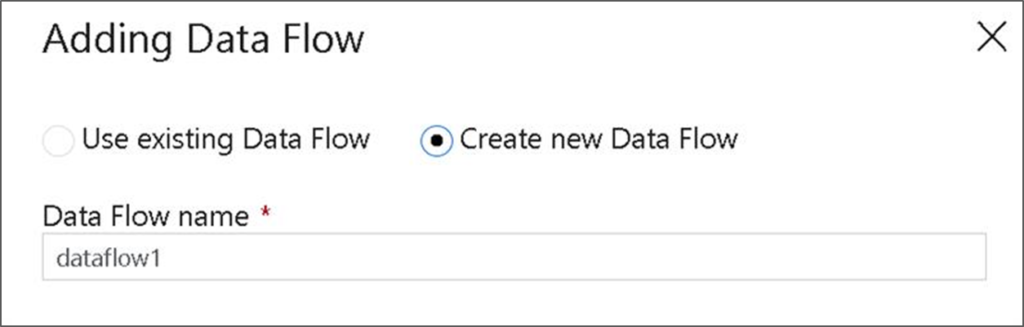
4. In the Adding Data Flow pop-up, select Create new Data Flow and then name your data flow TransformMovies. Click Finish when done.
5. In the top bar of the pipeline canvas, slide the Data Flow debug slider on. Debug mode allows for interactive testing of transformation logic against a live Spark cluster. Data Flow clusters take 5-7 minutes to warm up and users are recommended to turn on debug first if they plan to do Data Flow development

Build transformation logic in the data flow canvas
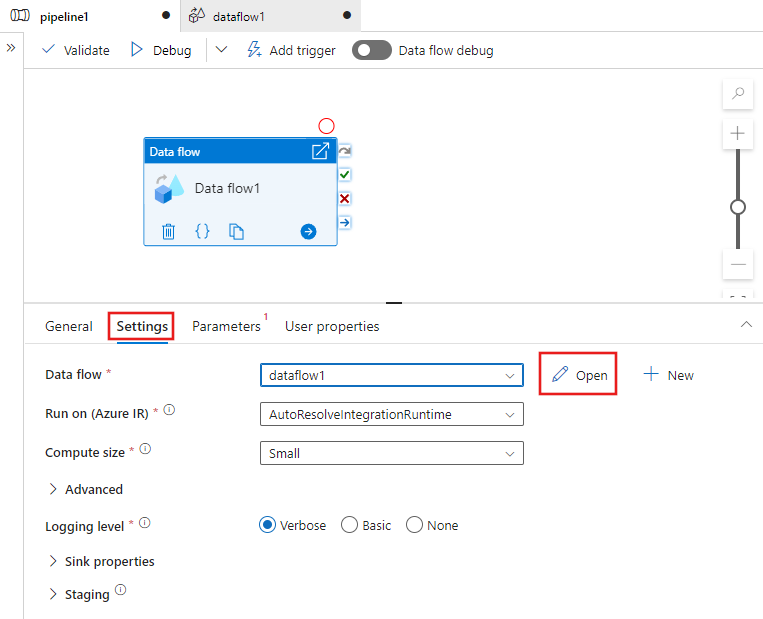
Once you create your Data Flow, you’ll be automatically sent to the data flow canvas. In case you are not redirected to data flow canvas, in the panel below the canvas, go to Settings and select Open, located beside data flow field. This will open the dataflow canvas.
In this step, you’ll build a data flow that takes the moviesDB.csv in ADLS storage and aggregates the average rating of comedies from 1910 to 2000. You’ll then write this file back to the ADLS storage.
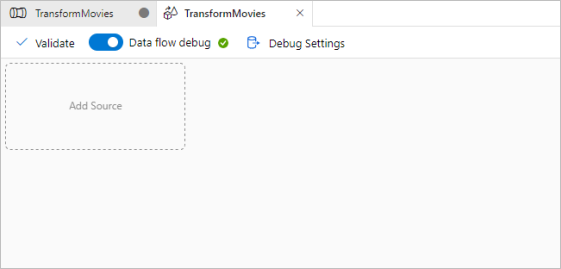
- In the data flow canvas, add a source by clicking on the Add Source box.
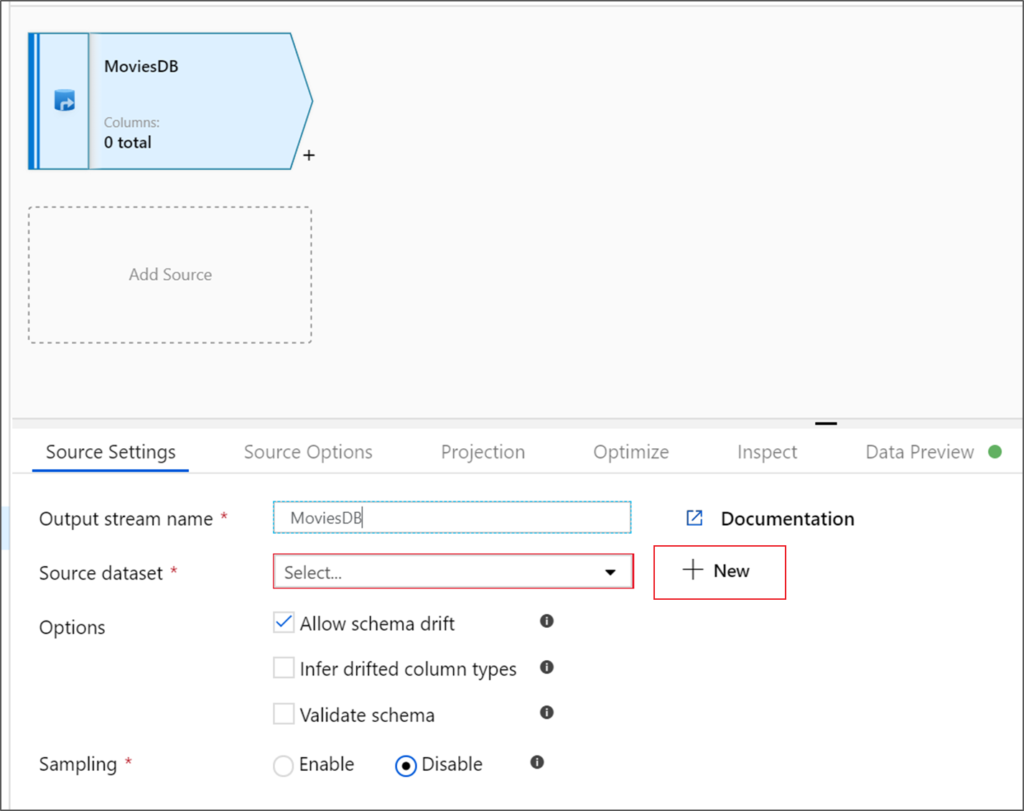
2. Name your source MoviesDB. Click on New to create a new source dataset.
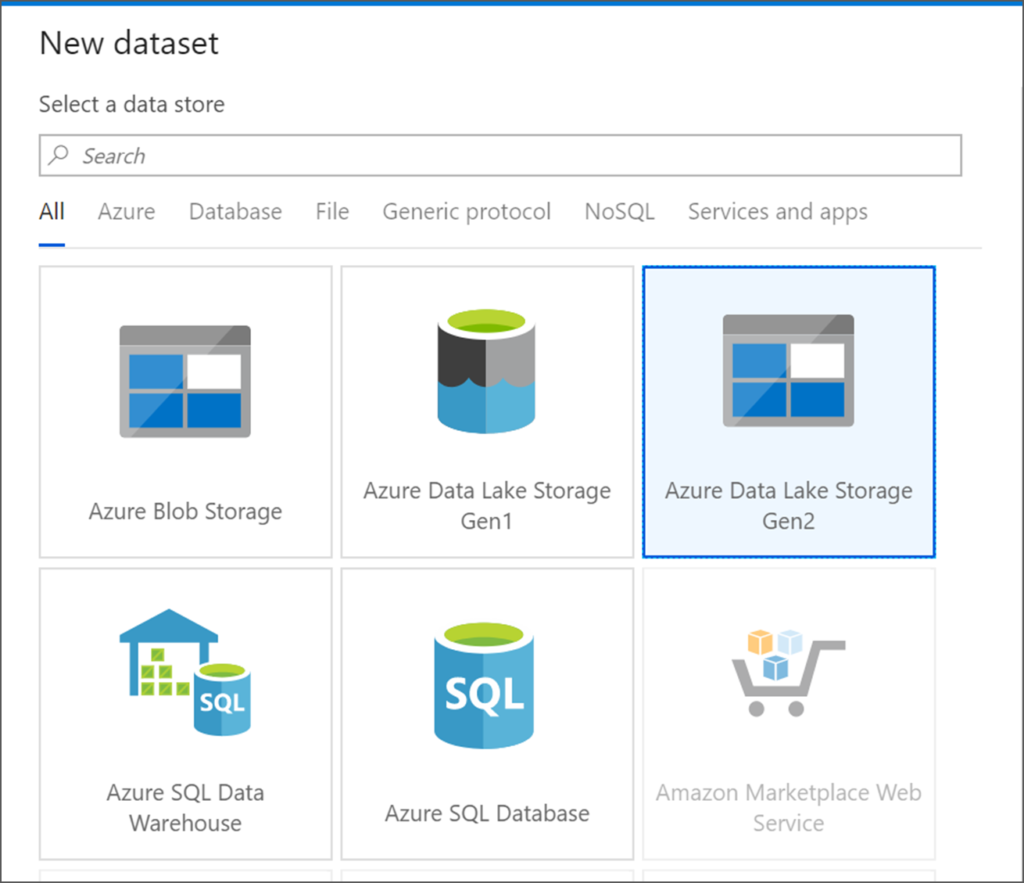
3. Choose Azure Data Lake Storage Gen2. Click Continue.

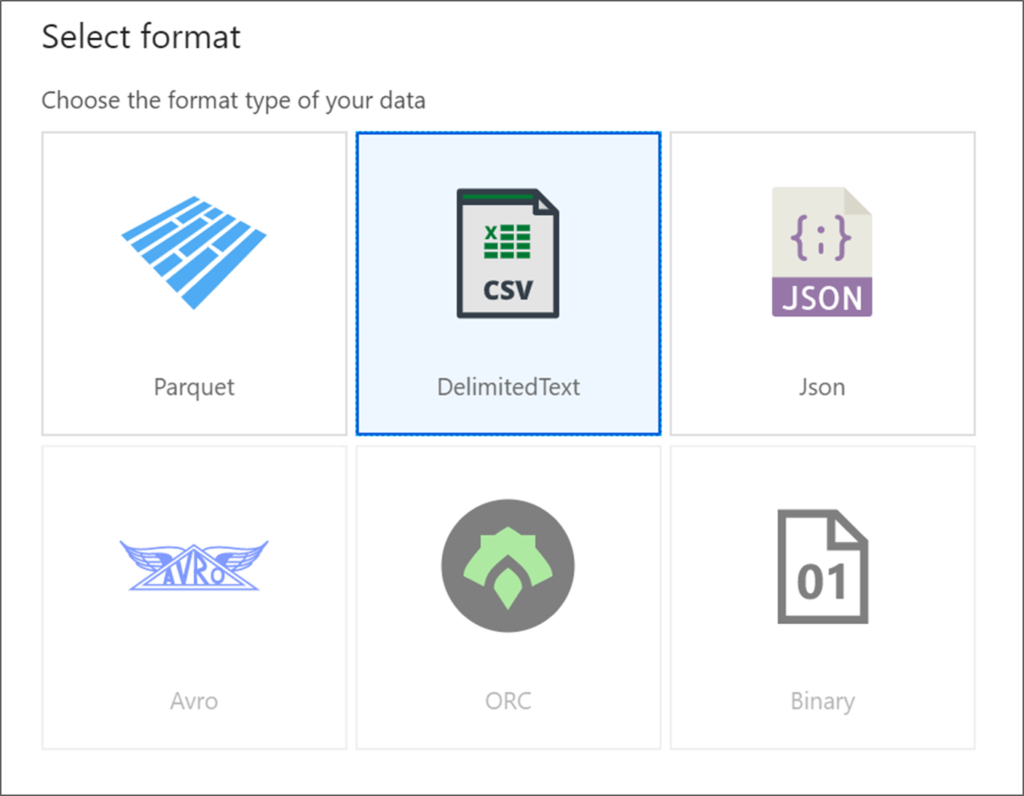
4. Choose DelimitedText. Click Continue.
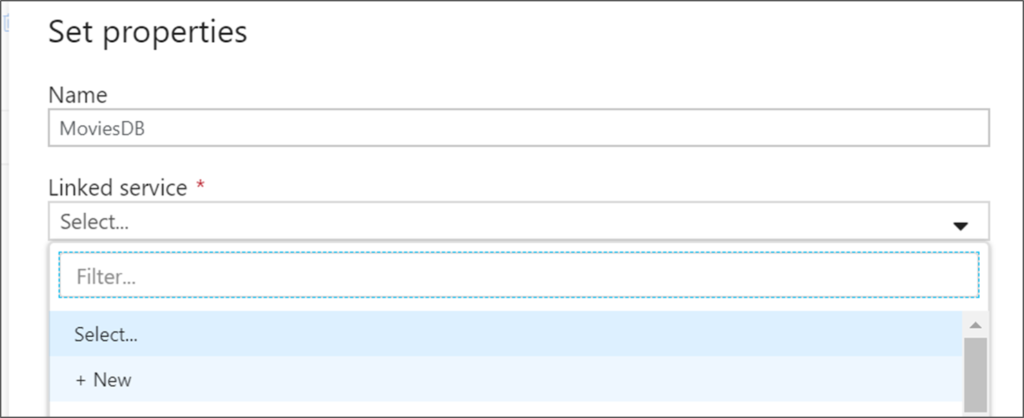
5. Name your dataset MoviesDB. In the linked service dropdown, choose New.
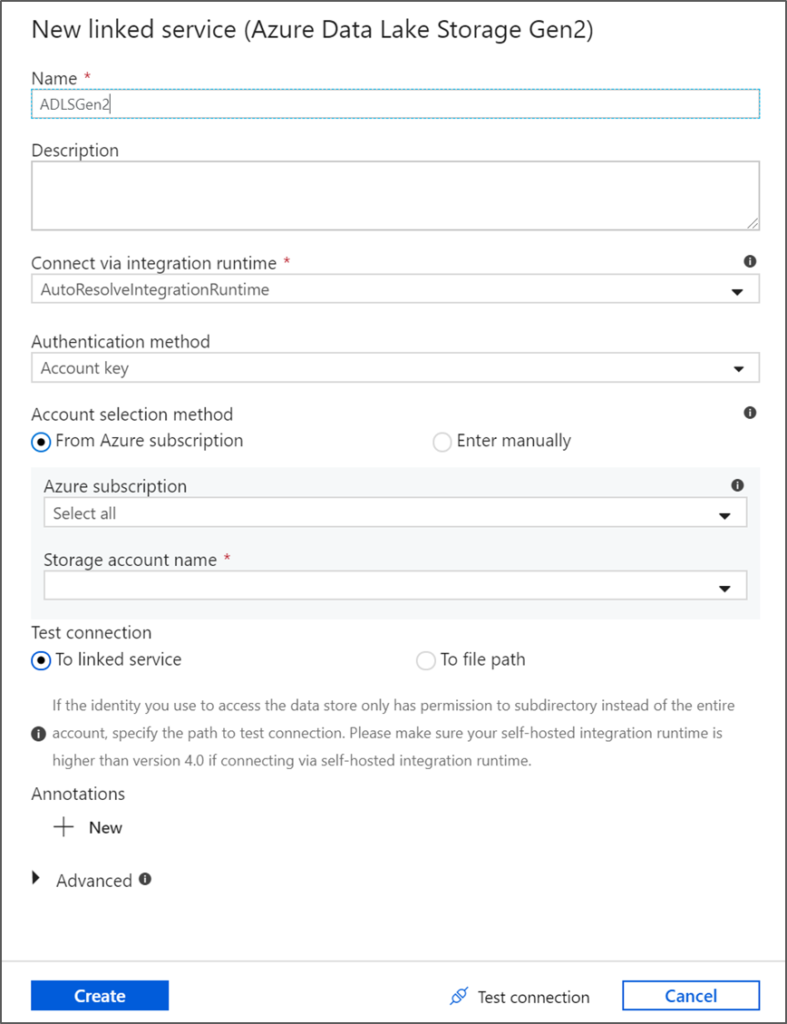
6. In the linked service creation screen, name your ADLS gen2 linked service ADLSGen2 and specify your authentication method. Then enter your connection credentials. In this tutorial, we’re using Account key to connect to our storage account. You can click Test connection to verify your credentials were entered correctly.
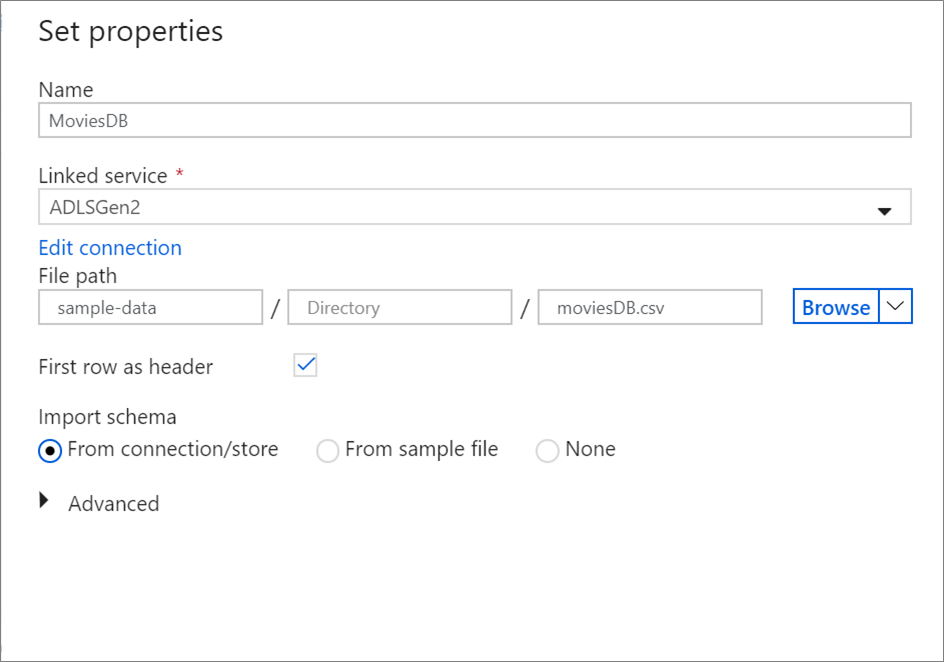
7. Once you’re back at the dataset creation screen, enter where your file is located under the File path field. In this tutorial, the file moviesDB.csv is located in container sample-data. As the file has headers, check First row as header. Select From connection/store to import the header schema directly from the file in storage. Click OK when done.
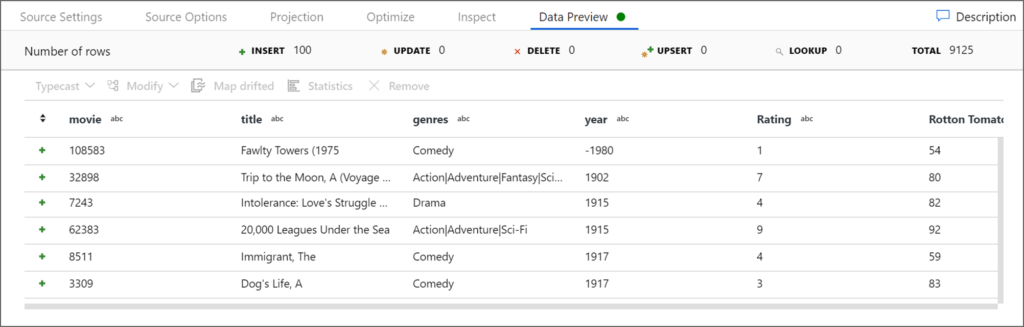
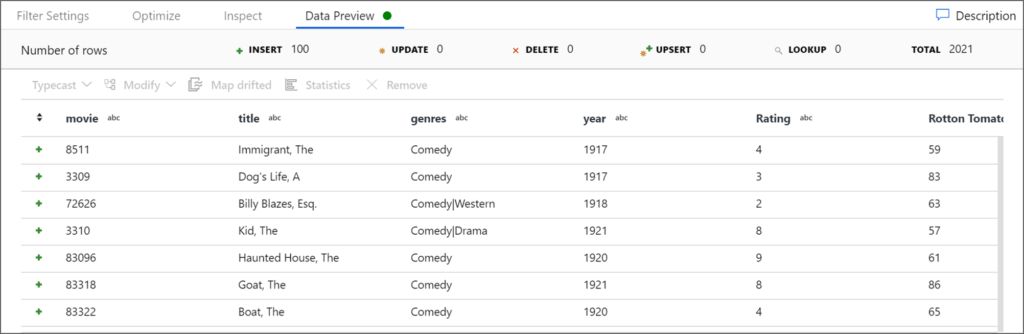
8. If your debug cluster has started, go to the Data Preview tab of the source transformation and click Refresh to get a snapshot of the data. You can use data preview to verify your transformation is configured correctly.
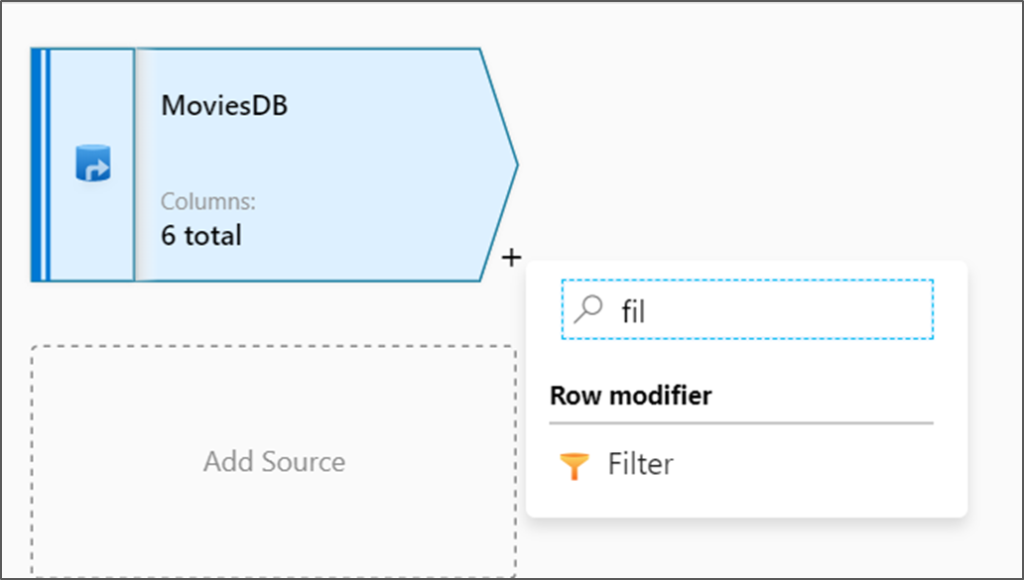
9. Next to your source node on the data flow canvas, click on the plus icon to add a new transformation. The first transformation you’re adding is a Filter.
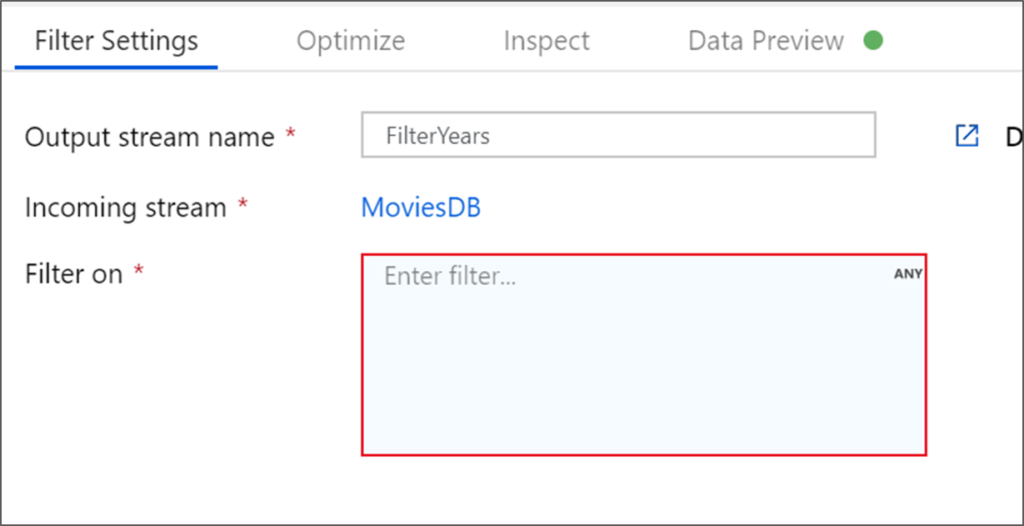
10. Name your filter transformation FilterYears. Click on the expression box next to Filter on to open the expression builder. Here you’ll specify your filtering condition.
11. The data flow expression builder lets you interactively build expressions to use in various transformations. Expressions can include built-in functions, columns from the input schema, and user-defined parameters.
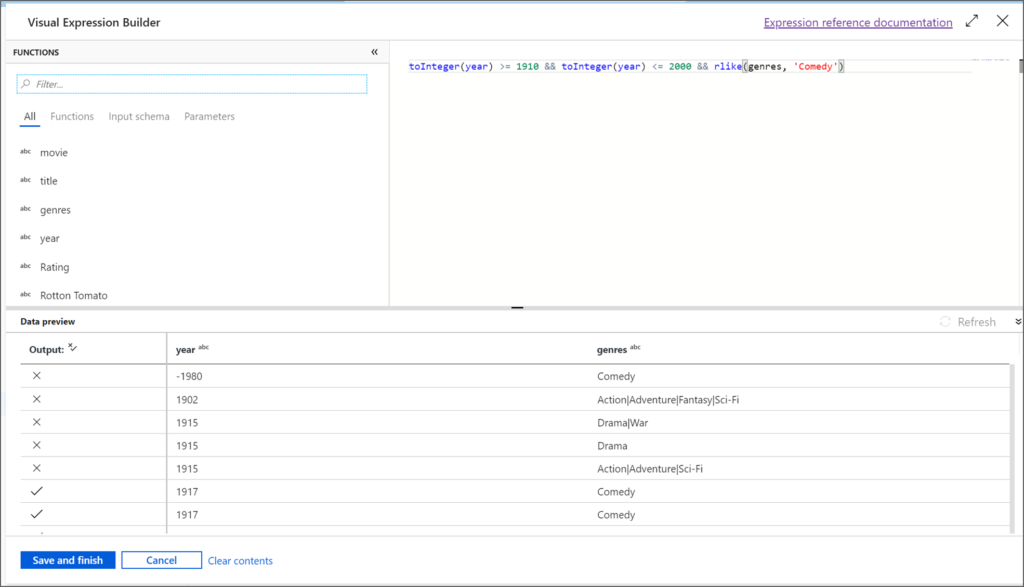
In this tutorial, you want to filter movies of genre comedy that came out between the years 1910 and 2000. As year is currently a string, you need to convert it to an integer using the toInteger() function. Use the greater than or equals to (>=) and less than or equals to (<=) operators to compare against literal year values 1910 and 2000. Union these expressions together with the and (&&) operator. The expression comes out as:
toInteger(year) >= 1910 && toInteger(year) <= 2000
To find which movies are comedies, you can use the rlike() function to find pattern ‘Comedy’ in the column genres. Union the rlike expression with the year comparison to get:
toInteger(year) >= 1910 && toInteger(year) <= 2000 && rlike(genres, 'Comedy')
If you’ve a debug cluster active, you can verify your logic by clicking Refresh to see expression output compared to the inputs used. There’s more than one right answer on how you can accomplish this logic using the data flow expression language.
Click Save and Finish once you’re done with your expression.
12. Fetch a Data Preview to verify the filter is working correctly.
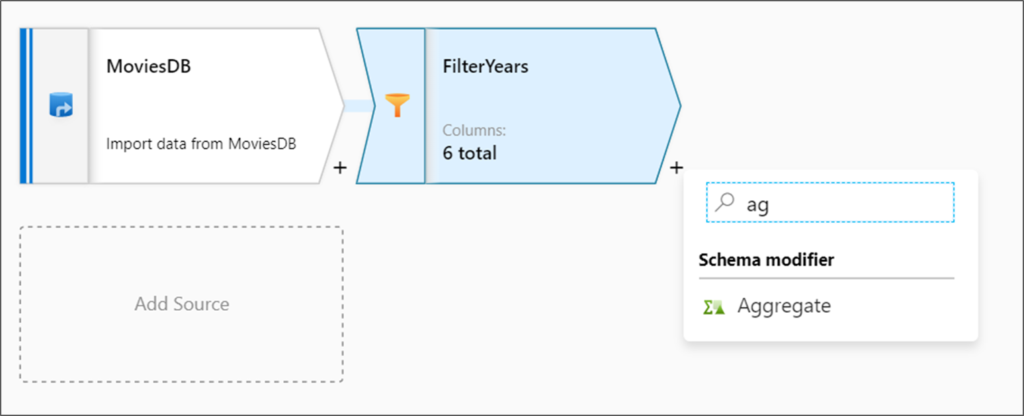
13. The next transformation you’ll add is an Aggregate transformation under Schema modifier.
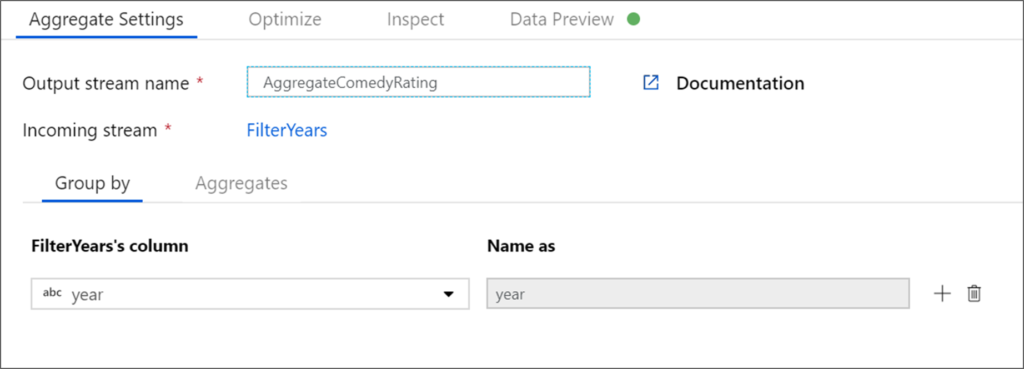
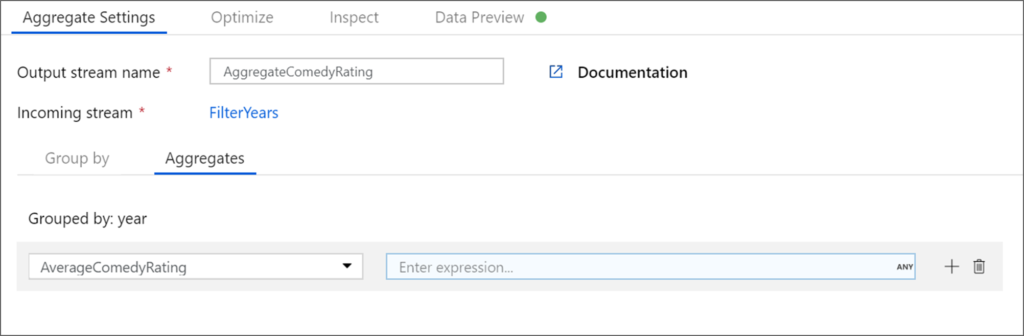
14. Name your aggregate transformation AggregateComedyRatings. In the Group by tab, select year from the dropdown to group the aggregations by the year the movie came out.
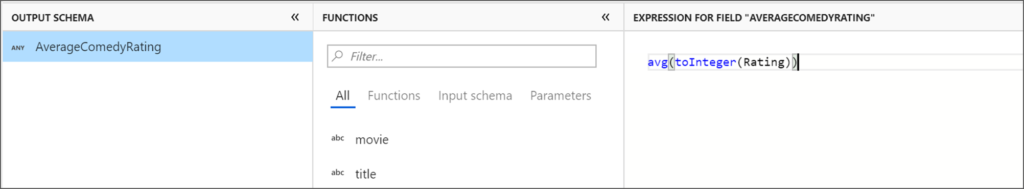
15. Go to the Aggregates tab. In the left text box, name the aggregate column AverageComedyRating. Click on the right expression box to enter the aggregate expression via the expression builder.

16. To get the average of column Rating, use the avg() aggregate function. As Rating is a string and avg() takes in a numerical input, we must convert the value to a number via the toInteger() function. This is expression looks like:
avg(toInteger(Rating))
Click Save and Finish when done.
17. Go to the Data Preview tab to view the transformation output. Notice only two columns are there, year and AverageComedyRating.
18. Next, you want to add a Sink transformation under Destination.
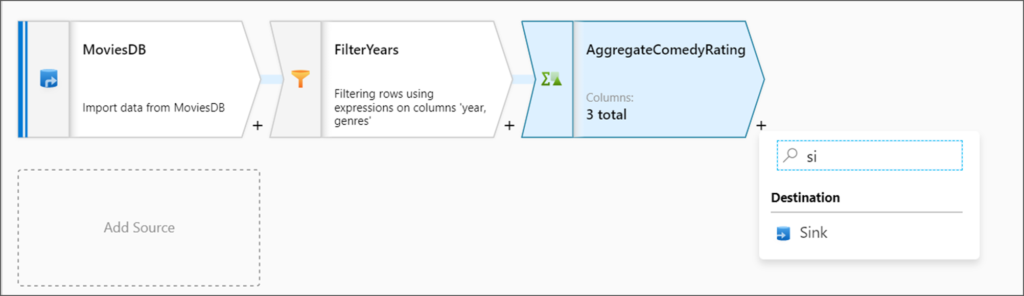
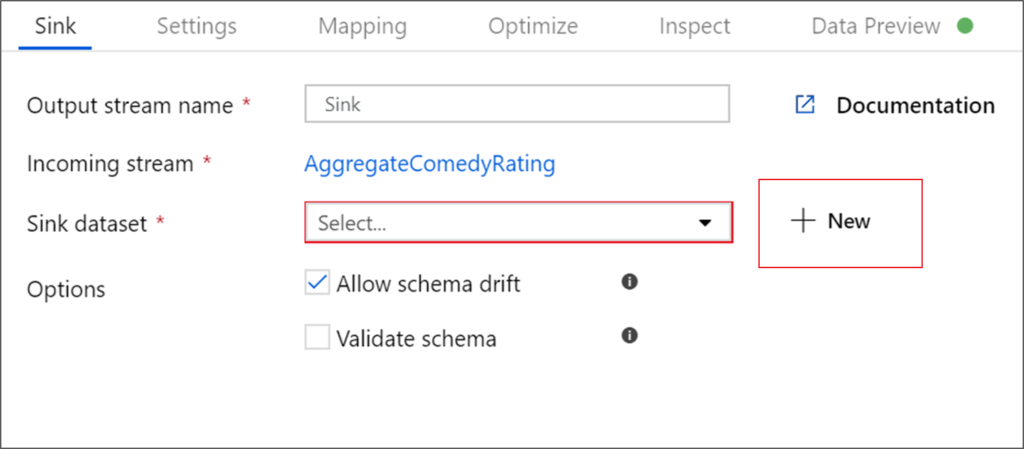
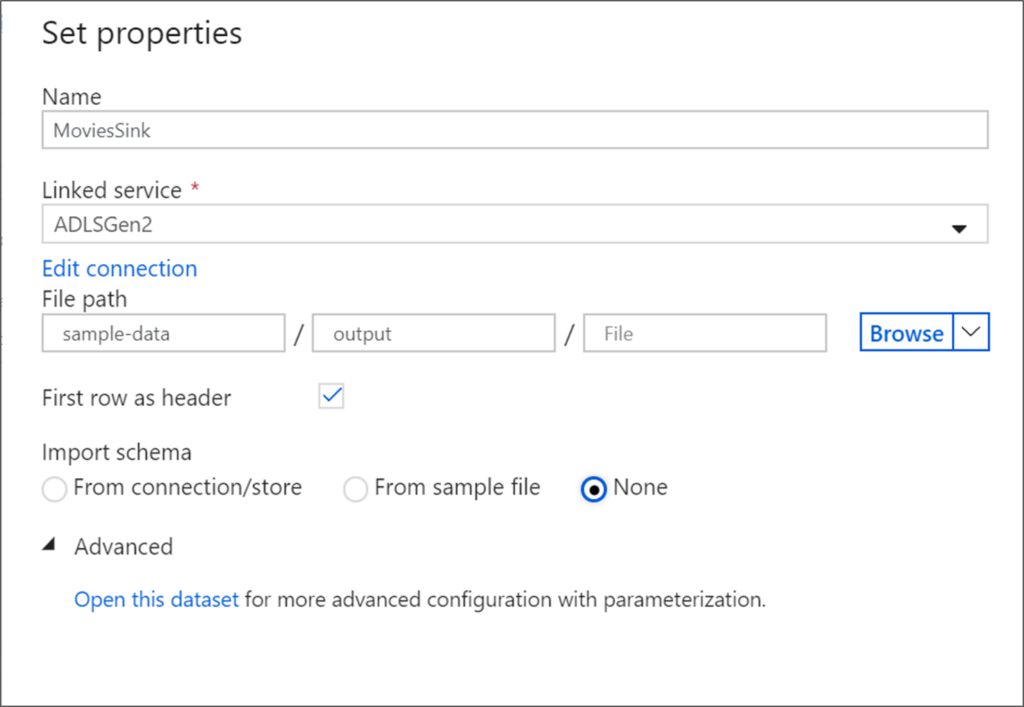
19. Name your sink Sink. Click New to create your sink dataset.
20. Choose Azure Data Lake Storage Gen2. Click Continue.
21. Choose DelimitedText. Click Continue.

22. Name your sink dataset MoviesSink. For linked service, choose the ADLS gen2 linked service you created in step 6. Enter an output folder to write your data to. In this tutorial, we’re writing to folder ‘output’ in container ‘sample-data’. The folder doesn’t need to exist beforehand and can be dynamically created. Set First row as header as true and select None for Import schema. Click Finish.
Now you’ve finished building your data flow. You’re ready to run it in your pipeline.
Running and monitoring the Data Flow
You can debug a pipeline before you publish it. In this step, you’re going to trigger a debug run of the data flow pipeline. While data preview doesn’t write data, a debug run will write data to your sink destination.
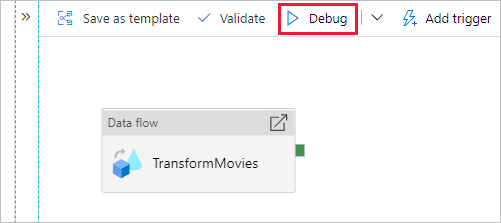
- Go to the pipeline canvas. Click Debug to trigger a debug run.
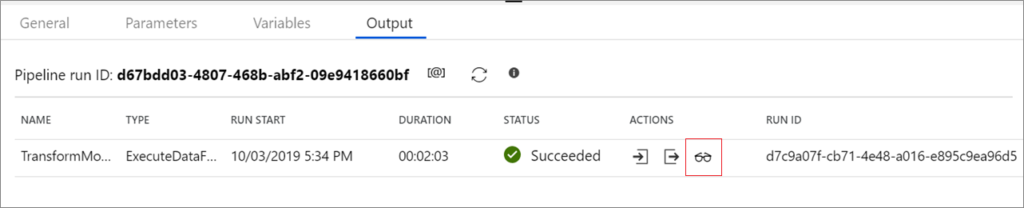
2. Pipeline debug of Data Flow activities uses the active debug cluster but still take at least a minute to initialize. You can track the progress via the Output tab. Once the run is successful, click on the eyeglasses icon to open the monitoring pane.
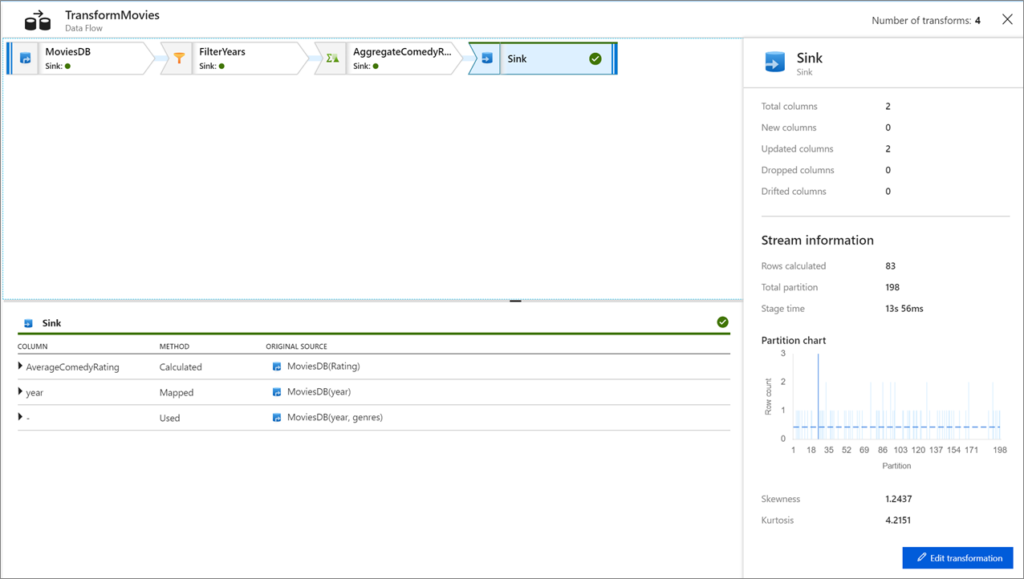
3. In the monitoring pane, you can see the number of rows and time spent in each transformation step.
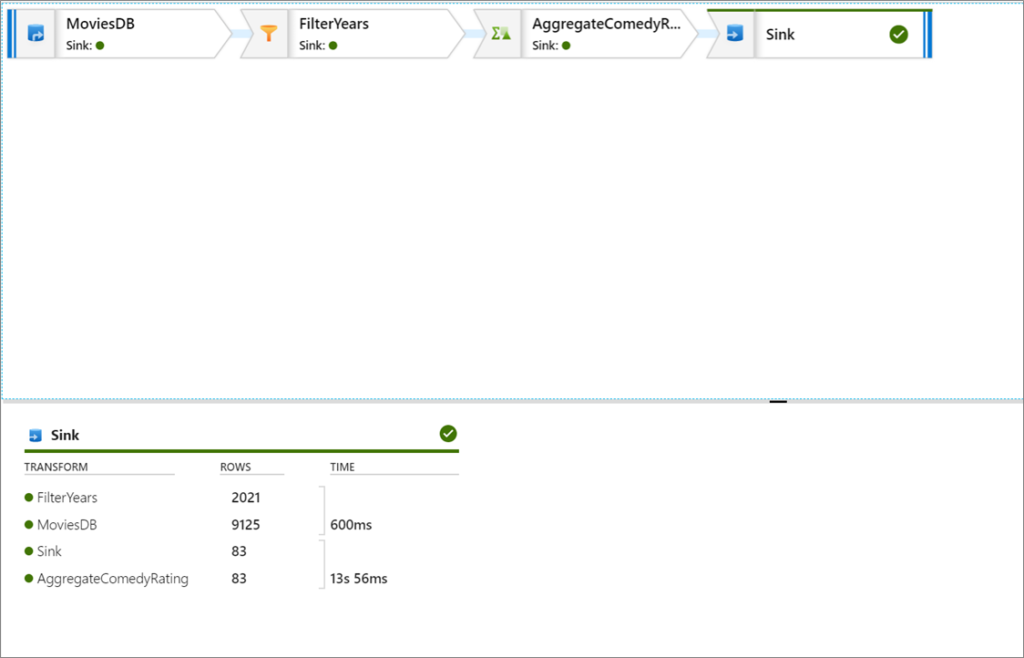
4. Click on a transformation to get detailed information about the columns and partitioning of the data.
Reference – https://learn.microsoft.com/
Leave a Reply