Tag data analysis

Pandas-DataFrame

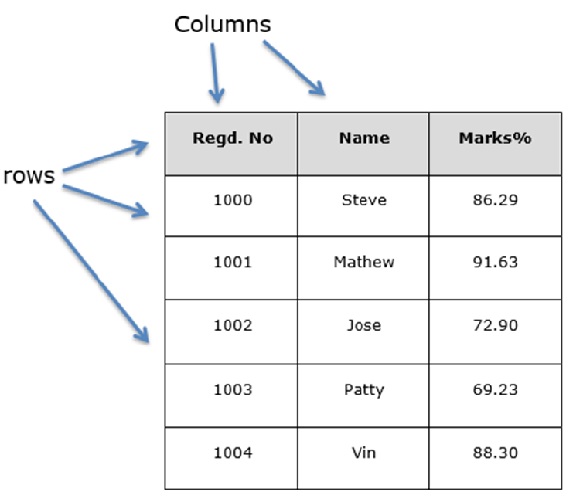
A data frame is a standard way to store data and data is aligned in a tabular fashion in rows and columns.

DataFrames are the workhorse of pandas and are directly inspired by the R programming language. We can think of a DataFrame as a bunch of Series objects put together to share the same index Let us assume that we are creating a data frame with student’s data, it will look something like this.

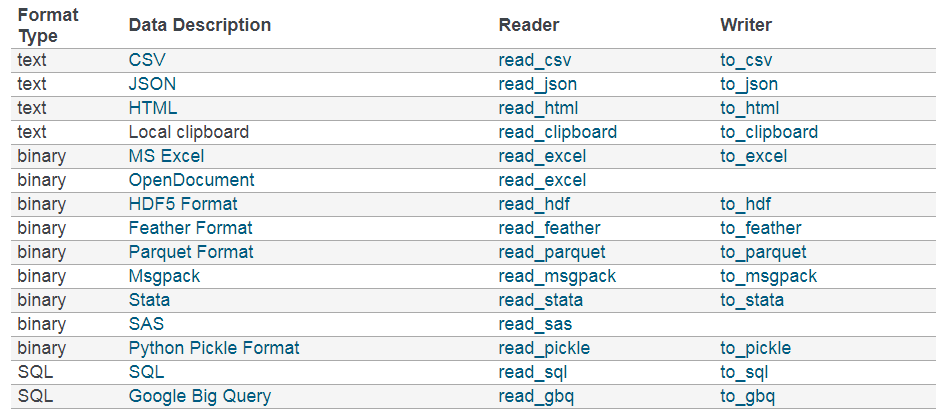
A pandas DataFrame can be created using the following constructor

pandas.DataFrame( data, index, columns, dtype, copy)

  • Data –  data takes various forms like ndarray, series, map, lists, dict, constants and also another DataFrame.
  • Index – For the row labels, the Index to be used for the resulting frame is Optional Default np.arrange(n) if no index is passed.
  • Columns – For column labels, the optional default syntax is – np.arrange(n). This is only true if no index is passed.
  • dtype – Data type of each column.
  • Copy – This command (or whatever it is) is used for copying of data, if the default is False.

Creations of DataFrame:

A pandas DataFrame can be created using various inputs like list, dict, series, numpy ndarray, another dataframe.

Let’s explore DataFrame with python in jupyter notebook.

Pandas-Data input and Output

To do data analysis successfully, a Data analyst should know how to read and write different file format such as .CSV, .XLS, .HTML, JASON etc.

DataFrame has a Reader and a Writer function. The Reader function allows you to read the different data formats while the Writer function enables you to save the data in a particular format.

Below is a table containing available readers and writers.

Following notebook is the reference code for getting input and output, pandas can read a variety of file types using it’s pd.read_ methods. Let’s take a look at the most common data types:

Pandas-Merging/Joining

Merging two datasets is the process of bringing two datasets together into one and aligning the rows from each based on common attributes or columns.

Data Merging:

The pandas.merge() method joins two  data frames and align the rows from each other  by a “key” variable that contains unique values.

In pandas there are separate “Merge” and “Join” method but both do the similar work.

With pandas.merge(), you can only combine 2 data frames at a time. If you have more than 2 data frames to merge, you will have to use this method multiple times.

Let’s see  pandas.merge() and some of the available arguments to pass. Here is the general structure and the recommended bare minimum arguments to pass.

pandas.merge(left_data_frame, right_data_frame, on= , how= )

  • left is one of the data frames.
  • right is the other data frame
  • on is the variable, a.k.a the column, on which you want to merge on. This is the keyvariable and has to be the same name in both data frames.
  • If the data frames has different column names for the merge variables then you can also use left_on and right_on.
    • left_on is the variable name in the left data frame to be merged on.
    • right_on is the variable name in the left data frame to be merged on.

how is where you pass the options of merging. These include:

  • inner”, where only the observations with matching values based on the “on” argument that is passed are kept.
  • left”, where all observations will be kept from the data frame in the left argument regardless if there is matching values with the data frame in the right argument. observations that do not have a matching value based on the on argument in the “right” data frame will be discarded.
  • right”, where all observations will be kept from the data frame in the right argument regardless if there is matching values with the data frame in the left argument. Observations that do not have a matching value based on the on argument in the “left” data frame will be discarded.
  • outer”, all observations will be kept from both data frames.

Now let’s understand the concepts with example.

We are going to use following data set for operation.

  • user_usage.csv – This dataset containing users monthly mobile usage details.
  • user_device.csv – This data set is containing details of an individual “use” of the system, with dates and device information.
  • android_devices.csv – This dataset with device and manufacturer data, which lists all Android devices and their model code.

Let’s understand the concept with coding..

Pandas-concat() method

The pandas.concat() method combines two data frames by stacking them on top of each other. If one of the data frames does not contain a variable column or variable rows, observations in that data frame will be filled with NaN values.

new_concat_dataframe = pd.concat([dataframe1, dataframe2], ignore_index= “true”)

Note – If you wish for a new index starting at 0, pass the “ignore_index” argument as “true”.

Let’s understand Concat() function through coding.

Pandas–Missing Data

In real scenario missing data is a big problem in data analysis. In machine learning and data mining accuracy get compromised because of poor quality of data caused by missing values.

Missing Data is represented as NA(Not Available) or NAN(Not a number) values in pandas.

Why data is missing?

Let’s suppose you have surveyed different people where you need their name, address, phone number and income, but some user don’t want to share their address and income so in this way many datasets went missing.

Finding missing values

To check missing values in pandas DataFrame we use function isnull() and notnull(). Both of the function checks whether the values is nan or not. These functions also used in Pandas Series, to find null values.

Cleaning / Filling Missing values:

There are following ways to treat missing values.

  1. Filling missing values using fillna(), replace():

To fill null values in data set we use fillna() and replace().To do this, we can call the fillna() function on a dataframe column and specifying either mean() or median() as a parameter.

#Impute with mean on column_1
df[‘column_1’] = df[‘column_1’].fillna( df[‘column_1’].mean() )

#Impute with median on column_1
df[‘column_1’] = df[‘column_1’].fillna( df[‘column_1’].median() )

Besides mean and median, imputing missing data with 0 can also be a good idea in some cases.

Impute with value 0 on column_1
df[‘column_1’] = df[‘column_1’].fillna(0)

2. Dropping missing values using dropna():

This is not a good method to handle missing value treatment. If your data has large number of missing value you can’t use this method because when you use this method you might be loose some important information.

In order to drop a null values from a dataframe, we used dropna() function this fuction drop Rows/Columns of datasets with Null values in different ways.

#Drop rows with null values
df = df.dropna(axis=0)

#Drop column_1 rows with null values
df[‘column_1’] = df[‘column_1’].dropna(axis=0)

The axis parameter determines the dimension that the function will act on.
axis=0 removes all rows that contain null values.
axis=1 removes all columns instead that contain null values.

Let’s understand the concept with python.

Pandas–Operations

There are various useful pandas operation available which is really handy in data analysis.

In this lecture we are going to cover following topics:

  • How to find unique values.
  • How to select data with multiple conditions?
  • How to apply function on a particular column?
  • How to remove column?
  • How to get column and index name?
  • Sorting by column
  • Checking null value
  • Filling in NaN values with something else
  • Pivot table creation
  • Change column name in pre-existing data frame.
  • .map() and .apply() function
  • Get column name in the data frame
  • Change order of column in the data frame
  • Add new column in existing data frame
  • Data type conversion
  • Date and time conversion

Let’s see all these operations in python