Clustering-Theory
What is Clustering?
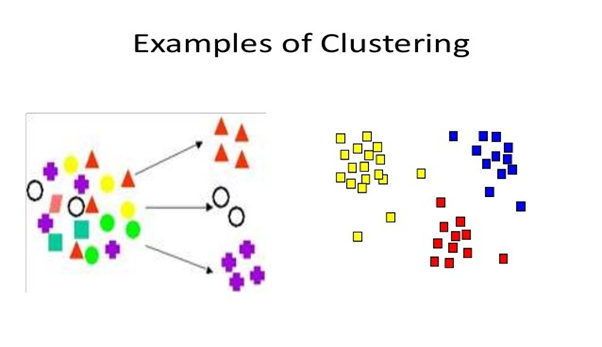
Clustering is a most popular unsupervised learning where population or data is grouped based on the similarity of the data-points.
Let’s understand this with an example. Suppose, you are the head of a general store and you want to understand preferences of your costumers to scale up your business. It will not possible for you to look at details of each costumer and devise a unique business strategy for each one of them. But, what you can do is to cluster all of your costumers into say 10 groups based on their purchasing habits and use a separate strategy for costumers in each of these 10 groups. This is called clustering.
To know more about unsupervised learning click here.
Following are the type of clustering application
- Marketing: Finding groups of customers with similar behaviour given a large database of customer data containing their properties and past buying records.
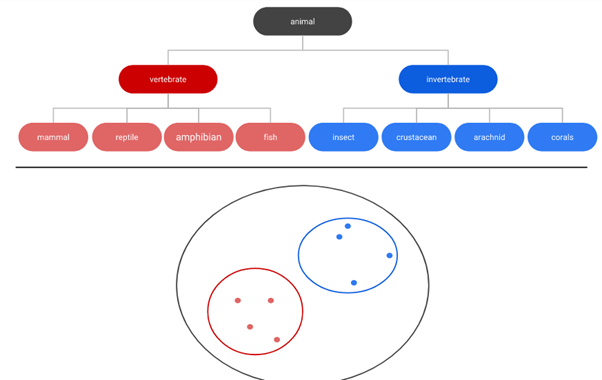
- Biology: Classification of plants and animals given their features.
- Libraries: Book ordering.
- Insurance: Identifying groups of motor insurance of policy holders with a high average claim cost; identifying frauds.
- City-planning: Identifying groups of houses according to their house type, value and geographical location
- Earthquake studies: Clustering helps to observe earthquake epicentres and identify dangerous zones.
- WWW: Document classification; clustering weblog data to discover groups of similar access patterns
Now let’s discuss the most popular clustering algorithms in detail – K Means clustering and Hierarchical clustering. Let’s begin.
Types of clustering algorithm:
There are several algorithms are available to solve clustering related problem. Every methodology follows a different set of rules for defining the ‘similarity’ among data points. In fact, there are more than 100 clustering algorithms known. But few of the algorithms are very popular, let’s look at them in detail:
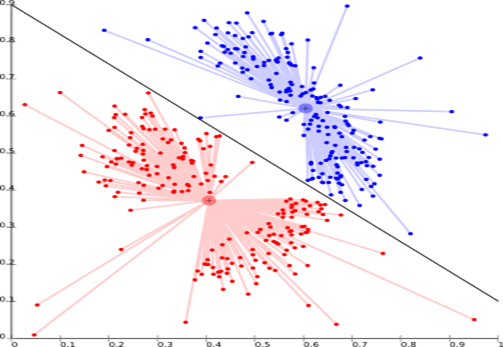
Centroid models: This is basically one of iterative clustering algorithm in which the clusters are formed by the closeness of data points to the centroid of clusters. Here, the cluster center i.e. centroid is formed such that the distance of data points is minimum with the center. K-Means clustering algorithm is a popular algorithm that falls into this category. The biggest problem with this algorithm is that we need to specify K in advance.
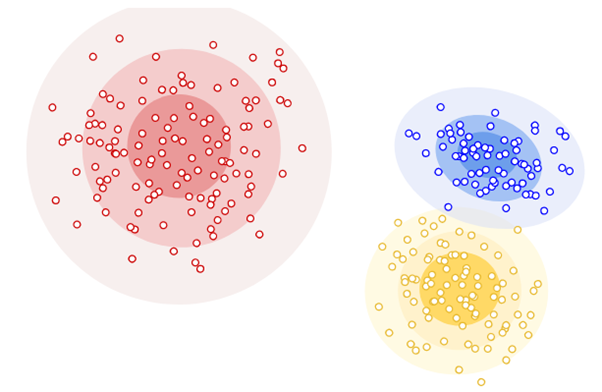
Distribution models: These clustering models are based on the notion of how probable is it that all data points in the cluster belong to the same distribution (For example: Normal, Gaussian). As distance from the distributions center increases, the probability that a point belongs to the distribution decreases. These models often suffer from overfitting. The bands show that decrease in probability. When you do not know the type of distribution in your data, you should use a different algorithm.
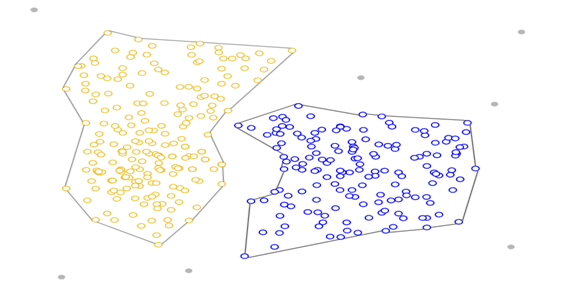
Density Models: Density-based clustering connects areas of high example density into clusters. These algorithms have difficulty with data of varying densities and high dimensions. Further, by design, these algorithms do not assign outliers to clusters.
K Means Clustering:
K means clustering is an effective, widely used, all-around used clustering algorithm. Before actually running it, we have to define a distance function between data points (for example, Euclidean distance if we want to cluster points in space), and we have to set the number of clusters we want (k)
The algorithm begins by selecting k points as starting centroids (‘centers’ of clusters). We can just select any k random points, or we can use some other approach, but picking random points is a good start.
This algorithm works in these 5 steps:
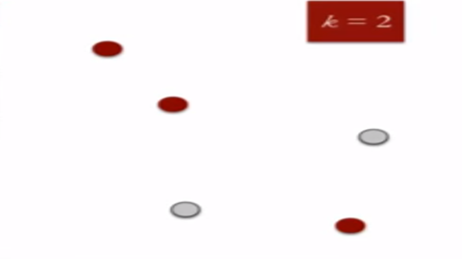
- Specify the desired number of clusters K : Let us choose k=2 for these 5 data points in 2-D space.

2. Randomly assign each data point to a cluster : Let’s assign three points in cluster 1 shown using red color and two points in cluster 2 shown using grey color.
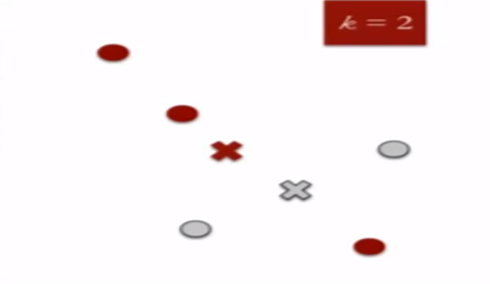
3. Compute cluster centroids : The centroid of data points in the red cluster is shown using red cross and those in grey cluster using grey cross.
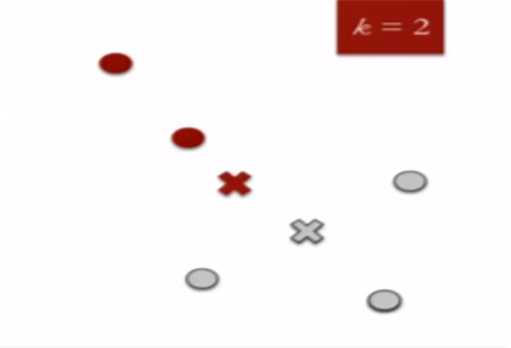
4. Re-assign each point to the closest cluster centroid : Note that only the data point at the bottom is assigned to the red cluster even though its closer to the centroid of grey cluster. Thus, we assign that data point into grey cluster.
5. Re-compute cluster centroids : Now, re-computing the centroids for both the clusters.
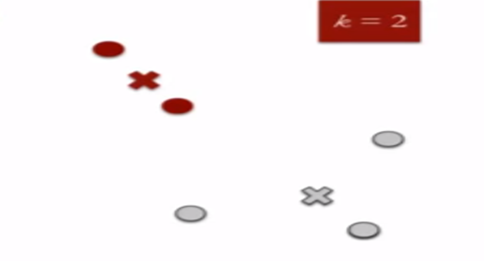
6. Repeat steps 4 and 5 until no improvements are possible : Similarly, we’ll repeat the 4th and 5th steps until we’ll reach global optima. When there will be no further switching of data points between two clusters for two successive repeats. It will mark the termination of the algorithm if not explicitly mentioned
Hierarchical Clustering
Hierarchical clustering creates a tree of clusters. Hierarchical clustering, not surprisingly, is well suited to hierarchical data, such as taxonomies. This algorithm starts with all the data points assigned to a cluster of their own. Then two nearest clusters are merged into the same cluster. In the end, this algorithm terminates when there is only a single cluster left.
There are two important things that we should know about hierarchical clustering:
- This algorithm has been implemented above using bottom up approach. It is also possible to follow top-down approach starting with all data points assigned in the same cluster and recursively performing splits till each data point is assigned a separate cluster.
- The decision of merging two clusters is taken
on the basis of closeness of these clusters. There are multiple metrics
for deciding the closeness of two clusters :
- Euclidean distance: ||a-b||2 = √(Σ(ai-bi))
- Squared Euclidean distance: ||a-b||22 = Σ((ai-bi)2)
- Manhattan distance: ||a-b||1 = Σ|ai-bi|
- Maximum distance:||a-b||INFINITY = maxi|ai-bi|
- Mahalanobis distance: √((a-b)T S-1 (-b)) {where, s : covariance matrix}
Difference between K Means and Hierarchical clustering
- Hierarchical clustering can’t handle big data well but K Means clustering can. This is because the time complexity of K Means is linear i.e. O(n) while that of hierarchical clustering is quadratic i.e. O(n2).
- In K Means clustering, since we start with random choice of clusters, the results produced by running the algorithm multiple times might differ. While results are reproducible in Hierarchical clustering.
- K Means is found to work well when the shape of the clusters is hyper spherical (like circle in 2D, sphere in 3D).
- K Means clustering requires prior knowledge of K i.e. no. of clusters you want to divide your data into. But, you can stop at whatever number of clusters you find appropriate in hierarchical clustering by interpreting the dendrogram