Archive October 2019

Why Python for data Analysis?

Python is very easy to learn and implement. For many people including myself python language is easy to fall in love with. Since his first appearance in 1991, python popularity is increasing day by day. Among interpreted languages Python is distinguished by its large and active scientific computing community. Adoption of Python for scientific computing in both industry applications and academic research has increased significantly since the early 2000s.

For data analysis and exploratory analysis and data visualization, Python has upper hand as compare with the many other domain-specific open source and commercial programming languages and tools, such as R, MATLAB, SAS, Stata, and others. In recent years, Python’s improved library support (primarily pandas) has made it a strong alternative for data manipulation tasks. Combined with python’s strength in general purpose programming, it is an excellent choice as a single language for building data-centric applications.

So in short we can say due to following reason we should choose python for data analysis.

  • It’s very simple language to understand.
  • It’s an open source.
  • Strong data science inbuilt library.
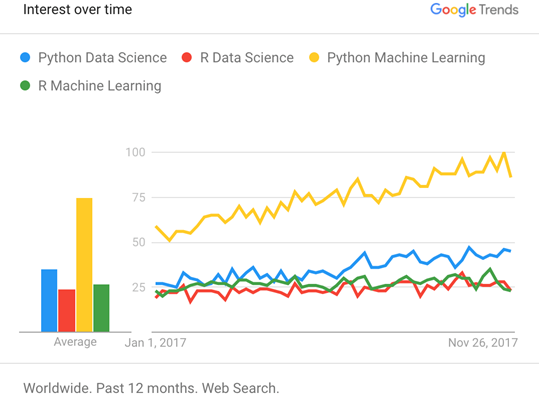
  • Apart from the long existing  demand in the web development projects, the use of Python is only growing to grow as AI/ML projects become more main stream and popular with global businesses.

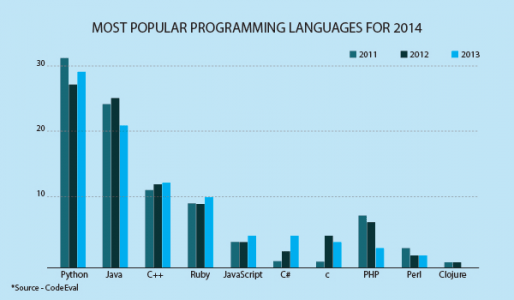
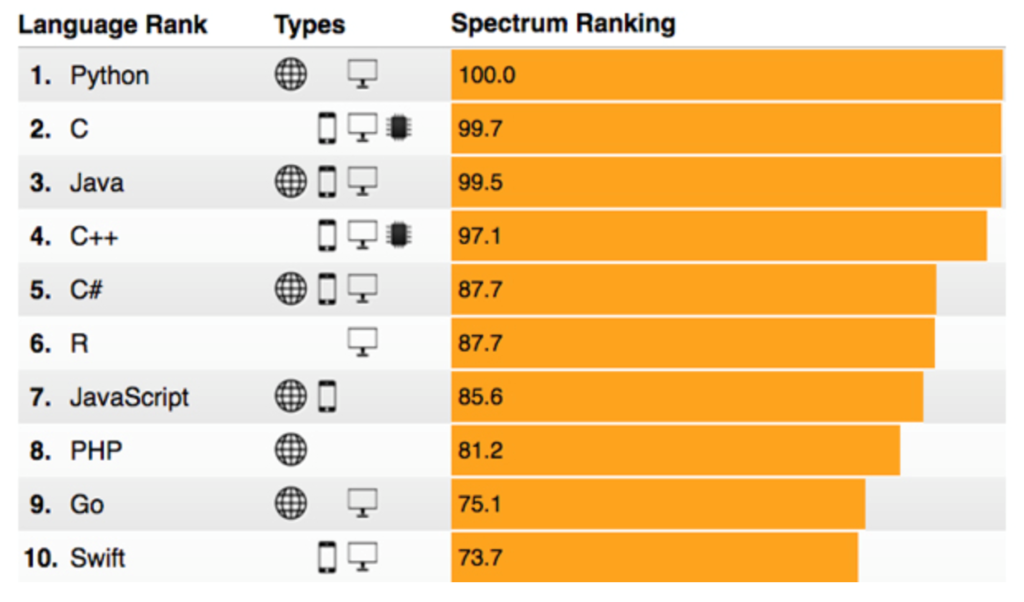
As you can see below chart, python is the most shouting language in the industry.

Over the year popularity

Trend in one year

IEEE Spectrum 2017 Survey

Python-Environment Setup

To successfully create and run the code we will required environment set up which will have both general-purpose python as well as the special packages required for Data science.

In this tutorial we will discuss about python 3, because Python 2 won’t be supported after 2020 and Python 3 has been around since 2008. So if you are new to Python, it is definitely worth much more to learn the new Python 3 and not the old Python 2.

Anaconda Installation:

Anaconda is a package manager, an environment manager, a Python/R data science distribution, and a collection of over 1,500+ open source packages. Anaconda is free and easy to install, and it offers free community support too.

To Download Anaconda click on https://www.anaconda.com/distribution/

Over 250+ packages are automatically installed with Anaconda. You can also download other packages using the pip install command.

If you need installation guide you can check the same on anaconda website https://docs.anaconda.com/anaconda/install/

Open Navigator for Window:

From the Start menu, click the Anaconda Navigator desktop app.

Anaconda Navigation

Run Python in a Jupyter Notebook:

  • On Navigator’s Home tab, in the Applications panel on the right, scroll to the Jupyter Notebook tile and click the Install button to install Jupyter Notebook.
  • Launch Jupyter Notebook by clicking Jupyter Notebook’s Launch button.This will launch a new browser window (or a new tab) showing the.
  • On the top of the right hand side, there is a drop down menu labeled “New”. Create a new Notebook with the Python version you installed.
  • Rename your Notebook. Either click on the current name and edit it or find rename  under File in the top menu bar. You can name it to whatever you’d like, but for this  example we’ll use MyFirstAnacondaNotebook.
  • In the first line of the Notebook, type or copy/paste print(“Hello Anaconda”)
  • Save your Notebook by either clicking the save and checkpoint icon or select File – Save and Checkpoint in the top menu.
  • Select cell and press CTR+Enter or Shift+Enter

NumPy–Introduction

NumPy  is the most basic and a powerful package for working with data in python. It stands for ‘Numerical Python’. It is a library consisting of multidimensional array objects and a collection of routines for processing of array. It contains a collection of tools and technique that can be used to solve on a computer mathematical models of problem in science and engineering.

If you are going to work on data analysis or machine learning projects, then you should have solid understanding of NumPy . Because other packages for data analysis (like pandas) is built on top of NumPy  and the scikit-learn package which is used to build machine learning applications works heavily with NumPy  as well .

What is Array?

A array is basically nothing but a pointer. It is a combination of memory address, a data type, a shapes and strides.

  • The data pointer indicates the memory address of the first bytes in the array.
  • The data type or dtype pointer describes the kind of elements that are contained within the array.
  • The shape indicates the shape of array
  • The strides are the numbers of bytes that should be skipped in memory to go to the next element. If your strides are (10,1) you need to proceed one byte to get the next column and 10 bytes to locate the next row.

So in short we can say an array contains information about the raw data, how to locate an element and how to interpret an element.

Operations using NumPy:

Using NumPy, a developer can perform the following operations −

  • Mathematical and logical operations on arrays.
  • Operations related to linear algebra. NumPy has in-built functions for linear algebra and random number generation.

Installation Instruction:

It is highly recommended you install Python using the Anaconda distribution to make sure all underlying dependencies (such as Linear Algebra libraries) all sync up with the use of a conda install. If you have Anaconda, install NumPy by going to your terminal or command prompt and typing:

conda install numpy
or
pip install numpy

 If you do not have Anaconda and can not install it, please refer to following url http://www.datasciencelovers.com/python-for-data-science/python-environment-setup/

Machine Learning – Introduction

What is machine learning?

Machine learning is a field of computer science which gives computer to learn from example through self-improvement and without being explicitly coded by programmer. In simple words, ML is a type of artificial intelligence that extracts patterns out of raw data by using an algorithm or method.  It is the most exciting technology in recent years.

ML is used in various tasks like fraud detection, predictive maintenance, portfolio optimization, automate task, clustering, sentiment analysis, image recognition, recommendation system and many more.

Prerequisites for Machine learning:

Reader should know basic python, python library like NumPy, Scikit-learn, Scipy, Matplotlib and seaborn. If these topics are new for you then we highly recommend you please go through Python for Data Science Tutorial.

Why Machine Learning?

Let’s understand it with an example, Think of a day when the sky is full of dark clouds and thunderstorms. The 1st thing that comes to your mind is, it’s going to rain today.

How did you know that it’s going to rain?

You know it because, in your life, whenever you have seen the sky behaving the same then it has rained, that’s what Machine Learning is all about.  

A machine is train to be learn from past experiences (data feed in) with respect to some class of tasks and it is performance in a given task improves with the experience.

Any technology user today has benefitted from machine learning. Facial recognition technology allows social media platforms to help users tag and share photos of friends. Optical character recognition (OCR) technology converts images of text into movable type. Recommendation engines, powered by machine learning, suggest what movies or television shows to watch next based on user preferences. Self-driving cars that rely on machine learning to navigate may soon be available to consumers. Risk analysis  for banking and finance industry. These all types of work is happening through machine learning.

Machine Learning Lifecycle:

Data Science process

What does it hold for the future?

Remember the robot helpers you saw in I, Robot? Imagine those in our day-to-day lives. Helping clean up our homes and generally making life even easier.

Traffic annoying you? How about you relaxed in the air conditioning of your car, and it took care of taking you to your destination? On its own?

Or how about as soon as you entered your doctor’s office, they have access to all your relevant medical details. Enabling them to provide you with a more personalized diagnosis?

Below image are few among hundreds of ways it makes our lives easier.

Future of machine learning

Types of Machine Learning

There are several Machine Learning algorithm and techniques which is used to build models for solving real-life problems by using data.

Now let’s discuss each type in details.

Supervised Learning:

Supervised learning technique is use when data set is structured. Structured dataset is one which has both input and output parameters. It is called supervised learning because we have a dataset which acts as a teacher and its role is to train the model or the machine. Once the model gets trained it can start making a prediction or decision when new data is given to it.

Supervised learning is the one where you have input variables (x) and an output variable (Y) and you use an algorithm to learn the mapping function from the input to the output.

Y = f(X)

The goal is to approximate the mapping function so well that whenever you get  new input data (x), the machine can easily predict the output variables (Y) for that data.

Supervised Learning Process

Unsupervised Learning:

Unsupervised learning is where we only have input data (X) and no corresponding output variables i.e Y.

The unsupervised model learns through observation and finds structures in the data. Once the model is given a dataset, it automatically finds patterns and relationships in the dataset by creating clusters in it. Unsupervised learning is used for raw datasets. Its main task is to convert raw data to structured data.

Unsupervised learning process

Now let’s understand both type of learning in details with example.

Suppose you had a basket and it is filled with some different kinds of fruits, your task is to arrange them as groups. For understanding let me clear the names of the fruits in our basket. We have four types of fruits. They are: apple, banana, grape and cherry.

SUPERVISED LEARNING:

  • You already learn from your previous work about the physical characters of fruits.
  • So arranging the same type of fruits at one place is easy now.
  • Your previous work is called as training data in data mining.
  • So, you already learn the things from your train data, this is because of response variable.
  • Response variable mean just a decision variable.

You can observe response variable below (FRUIT NAME) .

NO. SIZE COLOR SHAPE FRUIT NAME
1 Big Red Rounded shape with a depression at the top Apple
2 Small Red Heart-shaped to nearly globular Cherry
3 Big Green Long curving cylinder Banana
4 Small Green Round to oval, Bunch shape Cylindrical Grape
  • Suppose you have taken an new fruit from the basket then you will see the size, color and shape of that particular fruit.
  • If size  is Big, color is Red, shape is rounded shape with a depression at the top, you will conform the fruit name as apple and you will put in apple group. Likewise for other fruits also.
  • Job of groping fruits was done and happy ending.
  • You can observe in the table that  a column was labelled as “FRUIT NAME” this is called as response variable.
  • If you learn the thing before from training data and then applying that knowledge to the test data(for new fruit), This type of learning is called as Supervised Learning.
  • Classification come under Supervised learning.

UNSUPERVISED LEARNING

  • Suppose you had a basket and it is filled with some different types fruits,your task is to arrange them as groups.
  • This time you don’t know anything about that fruits, honestly saying this is the first time you have seen them.
  • So how will you arrange them? What will you do first?
  • You will take a fruit and you will arrange them by considering physical character of that particular fruit. suppose you have considered color.
  • Then you will arrange them on considering base condition as color.
  • Then the groups will be something like this.
  • RED COLOR GROUP: apples & cherry fruits.
  • GREEN COLOR GROUP: bananas & grapes.
  • So now you will take another physical character such as size .
  • RED COLOR AND BIG SIZE: apple.
  • RED COLOR AND SMALL SIZE: cherry fruits.
  • GREEN COLOR AND BIG SIZE: bananas.
  • GREEN COLOR AND SMALL SIZE: grapes.
  • Job done happy ending.
  • Here you didn’t know learn anything before, means no train data and no response variable.
  • This type of learning is known as unsupervised learning.
  • Clustering comes under unsupervised learning.

Semi-Supervised Learning:

As per name suggestion same supervised learning is a combination of Supervise learning and unsupervised learning and uses both labelled and unlabelled data for training. We use this type of Machine Learning for classification, regression, and prediction. Examples of semi-supervised learning are face- and voice-recognition applications.

Reinforcement Learning:

It follows traditional types of data analysis where algorithm discovers data through a process of trial and error and find out what is the best outcome.

There are three main components make up reinforcement learning: the agent, the environment, and the actions. The agent is the learner or decision-maker, the environment includes everything that the agent interacts with, and the actions are what the agent does.

Reinforcement Learning Process

Following are the hierarchy of machine learning.

Classification VS Regression

Before going to start working on machine learning model, we need to understand difference between classification and regression problem. Classification and Regression are two major prediction problems which are usually dealt in Data mining.

Although Classification and Regression come under the same umbrella of Supervised Machine Learning and share the common concept of using past data to make predictions, or take decisions, that’s where their similarity ends.

Regression in machine learning:

A regression problem is when the output variable is a real or continuous value, such as “salary” or “weight” or “sales”.

In machine learning, regression algorithms try to calculate the mapping function (f) from the input variables (x) to numerical or continuous output variables (y). In this case, y is a real value, which can be an integer or a floating point value. Therefore, regression prediction problems are usually quantities or sizes.

For example, when provided with a dataset about houses and you are asked to predict their prices that are a regression task because price will be a continuous output.

Common regression algorithms are: Linear regression, Support Vector Regression (SVR), and regression trees.

Note – Logistic regression, have the name “regression” in their names but they are not regression algorithms.

Classification in machine learning:

A classification problem is when the output variable is a category, such as “black” or “blue” or “disease” and “no disease”.

In classification algorithms we try to calculate the mapping function (f) from the input variables (x) to discrete or categorical output variables (y).

For example, we have a house dataset and we have to predict whether the prices for the houses “sell more or less than the recommended retail price”.  Here, the houses will be classified whether their prices fall into two discrete categories: above or below the said price.

Common classification algorithms are logistic regression, Naïve Bayes, decision trees, and K Nearest Neighbours.

So following are the main differences:

Basic for comparisonClassificationRegression
DefinitionA classification problem is when the output variable
is category such as ‘blue’
or ‘black’, disease and
no disease
A regression problem is
when the output variable is real or continuous value
such as sales, weight, salary
Involve prediction ofCategorical valueContinuous value
AlgorithmDecision tree, logistic regression, etcRegression tree (Random forest), Linear regression, etc.
Nature of the predicted dataUnorderedOrdered
Method of calculationMeasuring accuracy Measurement of root mean square error