Archive November 2019

Online Job Posting Analysis

Business Context:

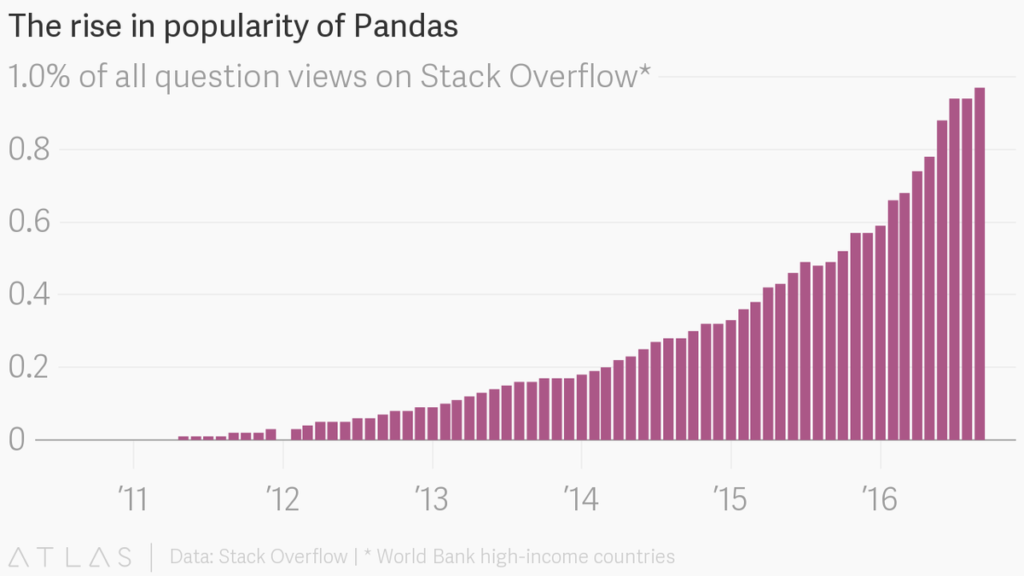
The project seeks to understand the overall demand for labour in the Armenian online job market from the 19,000 job postings from 2004 to 2015 posted on Career Center, an Armenian human resource portal. Through text mining on this data, we will be able to understand the nature of the ever-changing job market, as well as the overall demand for labour in the Armenia economy. The data was originally scraped from a Yahoo! Mailing group.

Business Objectives:

Our main business objectives are to understand the dynamics of the labour market of Armenia using the online job portal post as a proxy. A secondary objective is to implement advanced text analytics as a proof of concept to create additional features such as enhanced search function that can add additional value to the users of the job portal.

So as a Data scientist you need to answer following business questions .

Job Nature and Company Profiles:

What are the types of jobs that are in demand in Armenia? How are the job natures changing over time?

Desired Characteristics and Skill-Sets:

What are the desired characteristics and skill -set of the candidates based on the job description dataset? How these are desired characteristics changing over time?

IT Job Classification:

Build a classifier that can tell us from the job description and company description whether a job is IT or not, so that this column can be automatically populated for new job postings. After doing so, understand what important factors are which drives this classification.

Similarity of Jobs:

Given a job title, find the 5 top jobs that are of a similar nature, based on the job post.

What should be our Text mining goal?

For the IT Job classification business question, you should aim to create supervised learning classification models that are able to classify based on the job text data accurately, is it an IT job.

On the business question of Job Nature and Company Profiles. Unsupervised learning techniques, such as topic modelling and other techniques such as term frequency counting will be applied to the data, including time period segmented dataset. Qualitative assessment will be done on the results to help us understand the job postings.

To understand the desired characteristics and skill -sets demanded by employers in the job ads, unsupervised learning methods such as K-means clustering will be used after appropriate dimension reduction.

For Job Queries business question, we propose exploring the usage of Latent Semantic Model and Matrix Similarity methods for information retrieval. The results will be assessed qualitatively. To return the top 5 most similar job posting, the job text data are vectorised using different models such as word2vec, and doc2vec and similarity scores are obtained using cosine similarity scores, ranked and returned as the answer which is then evaluated individually for relevance.

Data Understanding:

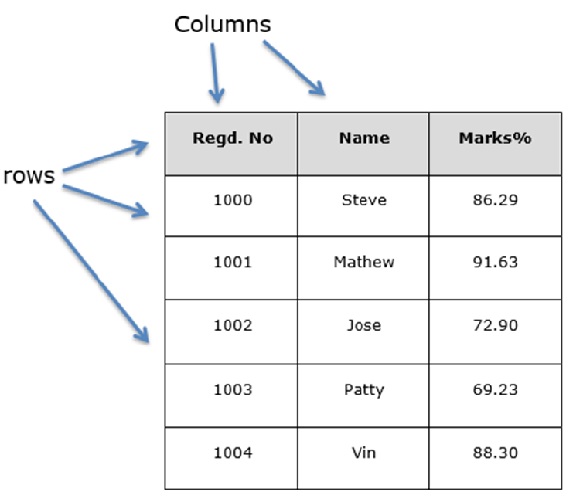
The data was obtained from Kaggle competition. Each row represents a job post. The dataset representation is tabular, but many of the columns are textual/unstructured in nature. Most notably, the columns job Description, Job Requirement, Required Qual, ApplicationP and AboutC are textual. The column job post is an amalgamation of these various textual columns.

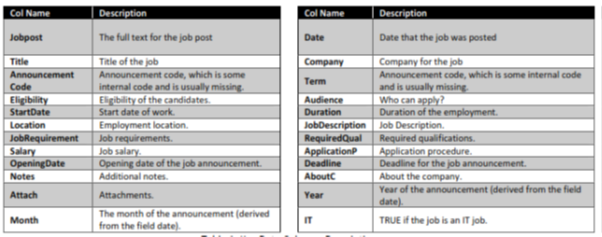
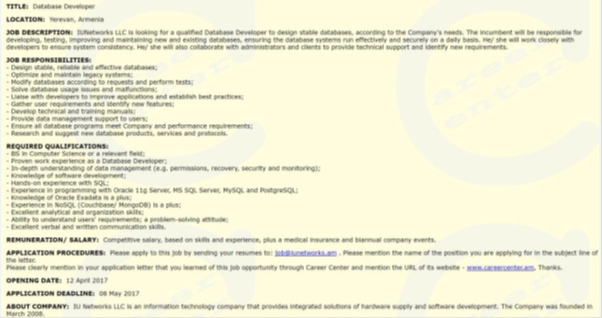
Also provided sample job posting (attached with data set)

Let’s develop a machine learning model for further analysis.

Bank Review and Complaints Analysis

Business Problem

Central banks collecting information about customer satisfaction with the services provided by different bank. Also collects the information about the complaints.

  • Bank users give ratings and write reviews about services on central bank websites. These reviews and ratings help to banks evaluate services provided and take necessary to action improve customer service. While ratings are useful to convey the overall experience, they do not convey the context which led a reviewer to that experience.
  • If we look at only the rating, it is difficult to guess why the user rated the service as 4 stars. However, after reading the review, it is not difficult to identify that the review talks about good “service” and “expectations”.

So the Business Requirement is to analyze customer reviews and predict customer satisfaction with the reviews. It should include following tasks.

  • Data processing
  • Key positive words/negative words (most frequent words)
  • Classification of reviews into positive, negative and neutral
  • Identify key themes of problems (using clustering, topic models)
  • Predicting star ratings using reviews
  • Perform intent analysis

Datasets:

BankReviews.xlsx.

The data is a detailed dump of customer reviews/complaints (~500) of different services at different banks.

Data Dictionary:

  • Date (Day the review was posted)
  • Stars (1–5 rating for the business)
  • Text (Review text),
  • Bank name

Let’s develop a machine learning model for further analysis.

NumPy-Functions

NumPy has many built-in functions and capabilities. We won’t cover them all but instead we will focus on some of the most important aspects of NumPy such as vectors, arrays, matrices, and number generation. Let’s start by discussing arrays.

NumPy arrays are the main way we will use NumPy throughout the course. NumPy arrays essentially come in two flavors: vectors and matrices. Vectors are strictly 1-d arrays and matrices are 2-d (but you should note a matrix can still have only one row or one column).

To know more about numpy function check the official documentation https://docs.scipy.org/doc/numpy/user/quickstart.html

Let’s begin our introduction by exploring how to create NumPy arrays. Please go through the jupyter notebook code. I have explained the code with comment, hope it will help you to understand the important functions of NumPy.

NumPy-Indexing and Selection

Indexing and Slicing are the important operations that you need to be familiar with when working with Numpy arrays. You can use them when you would like to work with a subset of the array. This tutorial will take you through Indexing and Slicing on multi-dimensional arrays.

Please refer to following .ipynb file for numpy implementation through python.

Pandas-Introduction

What is pandas?

Pandas is a python open source library which allow you to perform data manipulation, analysis and cleaning. It is build on top of NumPy . It is a most important library for data science.

According to Wikipedia “Pandas is derived from the term “panel data”, an econometrics term for data sets that include observations over multiple time periods for the same individuals.”

Why Pandas?

Following are the advantages of pandas for Data Scientist.

  • Easily handling missing data.
  • It provides an efficient way to slicing and data wrangling.
  • It is helpful to merge, concatenate or reshape the data.
  • It has includes a powerful time series tool to work with.

How to install Pandas?

To install python pandas go to command line/terminal and type “pip install pandas” or else if you have anaconda install in the system just type in “conda install pandas”. Once the installation is completed, go to your IDE(Jupyter) and simply import it by typing “import pandas as pd”.

In next chapter we will learn about pandas Series.

Pandas–Series

The first main data type we will learn about for pandas is the Series data type.

A series is a one-dimensional data structure. A Series is very similar to a NumPy array (in fact it is built on top of the NumPy array object). What differentiates the NumPy array from a Series, is that a Series can have axis labels, meaning it can be indexed by a label, instead of just a number location. It also doesn’t need to hold numeric data, it can hold any arbitrary Python Object.

10 23 56 17 52 61 73 90 26 72

So important point to remember for pandas series is:

  • Homogeneous data
  • Size Immutable
  • Values of Data Mutable

Let’s import Pandas and explore the Series object with the help of python.

Pandas-DataFrame

A data frame is a standard way to store data and data is aligned in a tabular fashion in rows and columns.

DataFrames are the workhorse of pandas and are directly inspired by the R programming language. We can think of a DataFrame as a bunch of Series objects put together to share the same index Let us assume that we are creating a data frame with student’s data, it will look something like this.

A pandas DataFrame can be created using the following constructor

pandas.DataFrame( data, index, columns, dtype, copy)

  • Data –  data takes various forms like ndarray, series, map, lists, dict, constants and also another DataFrame.
  • Index – For the row labels, the Index to be used for the resulting frame is Optional Default np.arrange(n) if no index is passed.
  • Columns – For column labels, the optional default syntax is – np.arrange(n). This is only true if no index is passed.
  • dtype – Data type of each column.
  • Copy – This command (or whatever it is) is used for copying of data, if the default is False.

Creations of DataFrame:

A pandas DataFrame can be created using various inputs like list, dict, series, numpy ndarray, another dataframe.

Let’s explore DataFrame with python in jupyter notebook.

Pandas-Data input and Output

To do data analysis successfully, a Data analyst should know how to read and write different file format such as .CSV, .XLS, .HTML, JASON etc.

DataFrame has a Reader and a Writer function. The Reader function allows you to read the different data formats while the Writer function enables you to save the data in a particular format.

Below is a table containing available readers and writers.

Following notebook is the reference code for getting input and output, pandas can read a variety of file types using it’s pd.read_ methods. Let’s take a look at the most common data types: