Banking Credit Card Spend Prediction and Identify Drivers for Spends

Business Problem:

One of the global banks would like to understand what factors driving credit card spend are. The bank want use these insights to calculate credit limit. In order to solve the problem, the bank conducted survey of 5000 customers and collected data.

The objective of this case study is to understand what’s driving the total spend (Primary Card + Secondary card). Given the factors, predict credit limit for the new applicants.

Data Availability:

  • Data for the case are available in xlsx format.
  • The data have been provided for 5000 customers.
  • Detailed data dictionary has been provided for understanding the data in the data.
  • Data is encoded in the numerical format to reduce the size of the data however some of the variables are categorical. You can find the details in the data dictionary

Let’s develop a machine learning model for further analysis.

Store Sales Prediction – Forecasting

Business Context:

The objective is predicting store sales using historical markdown data. One challenge of modelling retail data is the need to make decisions based on limited history. If Christmas comes but once a year, so does the chance to see how strategic decisions impacted the bottom line.

Business Problem:

Company provided with historical sales data for 45 Walmart stores located in different regions. Each store contains a number of departments, and you are tasked with predicting the department-wide sales for each store.

In addition, Walmart runs several promotional markdown events throughout the year. These markdowns precede prominent holidays, the four largest of which are the Super Bowl, Labour Day, Thanksgiving, and Christmas. The weeks including these holidays are weighted five times higher in the evaluation than non-holiday weeks. Part of the challenge presented by this competition is modelling the effects of markdowns on these holiday weeks in the absence of complete/ideal historical data.

Data Availability:

stores.csv: This file contains anonymized information about the 45 stores, indicating the type and size of store.

train.csv: This is the historical training data, which covers to 2010-02-05 to 2012-11- 01, Within this file you will find the following fields:

  • Store – the store number
  • Dept – the department number
  • Date – the week
  • Weekly_Sales – sales for the given department in the given store
  • IsHoliday – whether the week is a special holiday week

test.csv: This file is identical to train.csv, except we have withheld the weekly sales. You must predict the sales for each triplet of store, department, and date in this file.

features.csv: This file contains additional data related to the store, department, and regional activity for the given dates. It contains the following fields:

  • Store – the store number
  • Date – the week
  • Temperature – average temperature in the region
  • Fuel_Price – cost of fuel in the region
  • MarkDown1-5 – anonymized data related to promotional markdowns that Walmart is running. MarkDown data is only available after Nov 2011, and is not available for all stores all the time. Any missing value is marked with an NA.
  • CPI – the consumer price index
  • Unemployment – the unemployment rate
  • IsHoliday – whether the week is a special holiday week

Let’s develop a machine learning model for further analysis.

Linear Regression-Theory

Linear regression is a supervised machine learning technique where we need to predict a continuous output, which has a constant slope.

There are two main types of linear regression:

1. Simple Regression:

Through simple linear regression we predict response using single features.

If you recall, the line equation (y = mx + c) we studied in schools. Let’s understand what these parameters say and how this equation works in linear regression.

Y = βo + β1X + ∈

Where, Y = Dependent Variable ( This is the variable which we want to predict )

            X = Independent Variable ( This is the variable which we use to make prediction )

            βo – This is the intercept term. It is the prediction value you get when X = 0

            β1 – This is the slope term. It explains the change in Y when X changes by 1 unit.

∈ – This represents the residual value, i.e. the difference between actual and predicted values.

2. Multivariable regression:

It is nothing but extension of simple linear regression. It attempts to model the relationship between two or more features and a response by fitting a linear equation to observed data.

Multi variable linear equation might look like this, where w represents the coefficients, or weights, our model will try to learn.

f(x,y,z)=w1x+w2y+w3z

Let’s understand it with example.

In a company for sales predictions, these attributes might include a company’s advertising spend on radio, TV, and newspapers.

Sales=w1Radio+w2TV+w3News

Linear Regression geometrical representation

So our goal in linear regression model is:

Find a line or plane that best fits the data points. Here best fit means minimise the sum of errors across our training data.

Types of Deliverable in linear regression:

Typically there are following questions that a business wanted to know

  1. They wanted to know their sales or profit prediction.
  2. Drivers(What drives the sales?)
    • All variable that have significant beta.
    • Which factors are detrimental /incremental?
    •  All the drivers, which one should target first?(Variable with highest absolute value)
  3. How to predict drivers?
    • To answer this question, you need calculate (beta*X )for each X variable and you need to choose the highest value and accordingly you can choose your driver after that convince business why you have chosen the particular driver.

So now the question arises how we calculate Beta values?

To calculate the beta values we will use OLS(ordinary least squared) method.

Assumptions of Linear Regression:

1. X variables (Explanatory variable) should be linearly related to Y (Response Variable):

Meaning:

If you plot a scatter plot between x variable and Y, most of the data point should be around the straight line.

How to check?

Draw the scatter plot between each x variable and y variable.

What happens if the assumption is violated?

MSE(Mean Squared Error) will be high. MSE is nothing but the average of squared error occurred between the predicted values and actual values. It can be written as:

Linear Regression in Machine Learning

Where,

N=Total number of observation
Yi = Actual value
(a1xi+a0)= Predicted value.

What to do if variable is not linear?

  • Drop the variable – But in this case will loose the information.
  • Take log(x+1) of x variables. 

2.Residual or the Y variable should be normally distributed:

Meaning:

Residuals (errors) or Y, when plotted in a histogram produces a bell shaped curve.

Residuals: The distance between the actual value and predicted values is called residual. If the observed points are far from the regression line, then the residual will be high, and so cost function will high. If the scatter points are close to the regression line, then the residual will be small and hence the cost function.

How to check?

Plot a histogram of Y, when plotted histogram produces a bell- shaped curve then it follows normality.

Or we can also use  q-q plot(quantile- quantile plot) of residuals

What happens if the assumption is violated?

It means all the P values has been calculated wrongly.

What to do if assumption is violated?

In that case we need to transform our Y such a way so that it become normal. To do that we need to use log of Y.

3.There should not be any relationship between X variables (i.e no multicollinearity)

Meaning:

X variable should not have any linear relationship between themselves. It’s obvious that we don’t want same information in repeat mode.

How to check?

  1. Calculate correlation between every X with every other X variable.
  2. Second method is to, calculate VIF(Variance influence factor)

What happens if the assumption is violated?

Your beta’s values sign will fluctuate.

What to do if assumption is violated?

Drop those X variable whose VIF is greater than 10(VIF>10)

4. The variance of error should remain constant over value of Y (Homoscedasticity/ No heteroskedasticity )

Meaning:

Spread of residuals should remain constant with values of Y.

How to check?

Draw scatter plot of residuals VS Y.

What happens if the assumption is violated?

Your P value will not accurate.

What to do if assumption is violated?

In that case we need to transform our Y such a way so that it become normal. To do that we need to use log of Y.

5. There should not be any auto-correlation between the residuals.

Meaning:

Correlation of residuals with lead residuals. Here lead residuals means next calculated residual.

How to check?

Use DW stats(Durbin Watson Stats)

            If DW stats ~ 2, then no auto correlation.

What happens if the assumption is violated?

Your P value will not accurate.

What to do if assumption is violated?

Understand the reason why it is happening?

If autocorrelation is due to Y then cannot build linear regression model.

If autocorrelation is due to X then drop that X variable.

How to check Model Performance?

The Goodness of fit determines how the line of regression fits the set of observations. The process of finding the best model out of various models is called optimization. It can be achieved by below method:

R-squared method:

  • R-squared is a statistical method that determines the goodness of fit.
  • It measures the strength of the relationship between the dependent and independent variables on a scale of 0-100%.
  • The high value of R-square determines the less difference between the predicted values and actual values and hence represents a good model.
  • It is also called a coefficient of determination, or coefficient of multiple determination for multiple regression.
  • It can be calculated from the below formula:
Linear Regression in Machine Learning

In the next lecture we will see how to implement leaner regression in python.

Random Forest-Theory

image source – google.com

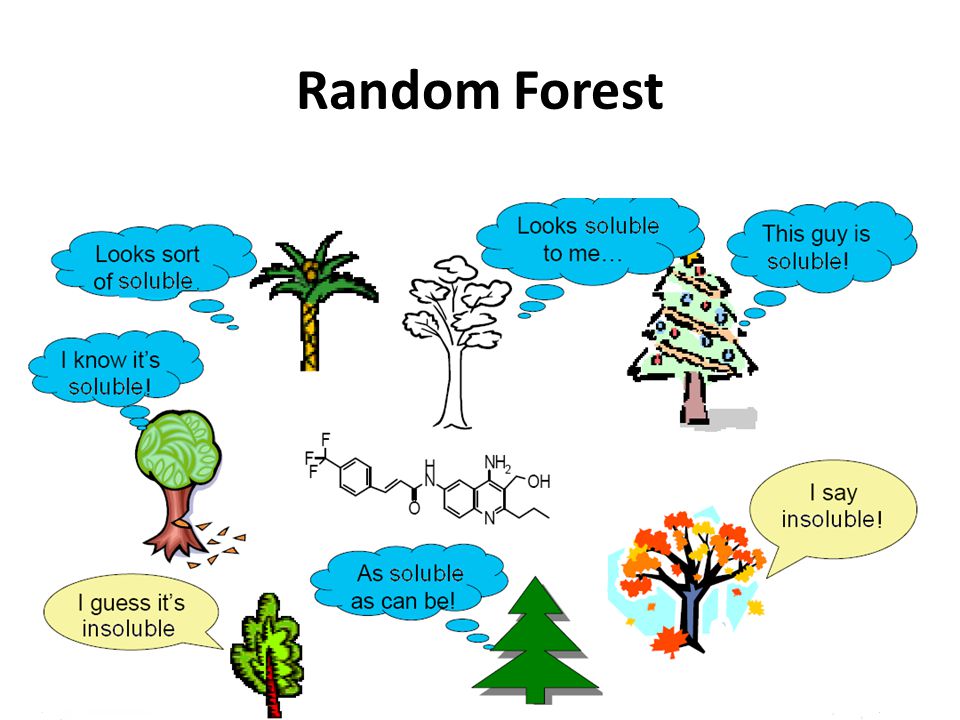
Random forest algorithm is a supervised algorithm. As you can guess from its name this algorithm creates a forest with number of trees. It operates by constructing multiple decision trees. The final decision is made based on the majority of the trees and is chosen by the random forest.

image source – google.com

The method of combining trees is known as an ensemble method. Ensembling is nothing but a combination of weak learners (individual trees) to produce a strong learner.

Let’s understand ensemble with an example. Let’s suppose you want to watch movie but you have doubt in your mind regarding it’s reviews, so you have asked 10 people who have watched the movie, 8 of them said movie is fantastic and 2 of them said movie was not good. Since the majority is in favour, you decide to watch the movie. This is how we use ensemble techniques in our daily life too.

Random Forest can be used to solve regression and classification problems. In regression problems, the dependent variable is continuous. In classification problems, the dependent variable is categorical.

Advantages and Disadvantages of Random Forest

Advantages are as follows:

  1. It is used to solve both regression and classification problems.
  2. It can be also used to solve unsupervised ML problems.
  3. It can handle thousands of input variables without variable selection.
  4. It can be used as a feature selection tool using its variable importance plot.
  5. It takes care of missing data internally in an effective manner.

Disadvantages are as follows:

  1. This is a black-box model so Random Forest model is difficult to interpret.
  2. It can take longer than expected time to computer a large number of trees.

How Random Forest works?

Algorithm can be divided into two stages.

  • Random forest creation.
  • Perform prediction from the created random forest classifier.

Random forest creation:

To create random forest we need to select following steps

  1. Randomly select “k” features from total “m” features, where k << m.
  2. Among the “k” features, calculate the node “d” using the best split point.
  3. Split the node into child nodes using the best split.
  4. Repeat 1 to 3 steps until “L” number of nodes has been reached.
  5. Build forest by repeating steps 1 to 4 for “n” number times to create “n” number of trees.

Perform prediction from the created random forest classifier

To perform prediction we need to take following steps

  1. Takes the test features and use the rules of each randomly created decision tree to predict the outcomes and stores the predicted outcome (target)
  2. Calculate the votes for each predicted target.
  3. Consider the high voted predicted target as the final prediction from the random forest algorithm.

Set the parameters for the random forest model:

Parameters = {‘bootstrap’: True,’min_samples_leaf’: 3, ‘n_estimators’: 50, ‘min_samples_split’: 10, ‘max_features’: ‘sqrt’,’max_depth’: 6,’max_leaf_nodes’: None} 

Hyperparameters Tuning of Random forest classifier:

bootstrap : boolean, optional (default=True)

min_samples_leaf : int, float, optional (default=1)

The minimum number of samples required to be at a leaf node:

  • If int, then consider min_samples_leaf as the minimum number.
  • If float, then min_samples_leaf is a percentage and ceil(min_samples_leaf * n_samples) are the minimum number of samples for each node.

n_estimators : integer, optional (default=10):

  • The number of trees in the forest.

min_samples_split : int, float, optional (default=2):

The minimum number of samples required to split an internal node:

  • If int, then consider min_samples_split as the minimum number.
  • If float, then min_samples_split is a percentage and ceil(min_samples_split * n_samples) are the minimum number of samples for each split.

max_features : int, float, string or None, optional (default=”auto”):

The number of features to consider when looking for the best split:

  • If int, then consider max_features features at each split. -If float, then max_features is a percentage and int(max_features * n_features) features are considered at each split.
  • If “auto”, then max_features=sqrt(n_features).
  • If “sqrt”, then max_features=sqrt(n_features) (same as “auto”).
  • If “log2”, then max_features=log2(n_features).
  • If None, then max_features=n_features.

max_depth : integer or None, optional (default=None):

The maximum depth of the tree. If None, then nodes are expanded until all leaves are pure or until all leaves contain less than min_samples_split samples.

max_leaf_nodes : int or None, optional (default=None):

Grow trees with max_leaf_nodes in best-first fashion. Best nodes are defined as relative reduction in impurity. If None then unlimited number of leaf nodes.

If you want to learn more about the rest of hyperparameters , check here

K-Nearest Neighbors (KNN) – Theory

K-nearest neighbors (KNN) algorithm is a type of supervised ML algorithm which can be used for both classification as well as regression problems. However, it is mainly used for classification problems in the industry.

Following are the some important points regarding KNN-algorithm.

  • K-Nearest Neighbor is one of the simplest Machine Learning algorithms based on Supervised Learning technique.
  • K-NN algorithm assumes the similarity between the new case/data and available cases and put the new case into the category that is most similar to the available categories.
  • K-NN algorithm stores all the available data and classifies a new data point based on the similarity. This means when new data appears then it can be easily classified into a well suite category by using K- NN algorithm.
  • K-NN is a non-parametric algorithm, which means it does not make any assumption on underlying data.
  • It is also called a lazy learner algorithm because it does not learn from the training set immediately instead it stores the dataset and at the time of classification, it performs an action on the dataset.
  • KNN algorithm at the training phase just stores the dataset and when it gets new data, then it classifies that data into a category that is much similar to the new data.

Now let’s understand the algorithm with an example.

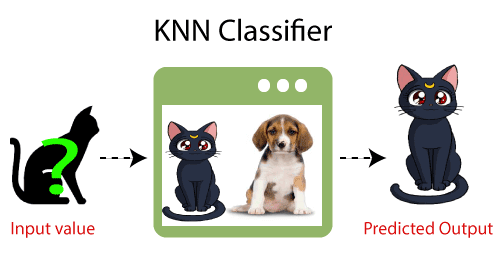
Suppose, we have an image of a creature that looks similar to cat and dog, but we want to know either it is a cat or dog. So for this identification, we can use the KNN algorithm, as it works on a similarity measure. Our KNN model will find the similar features of the new data set to the cats and dogs images and based on the most similar features it will put it in either cat or dog category.

Why do we need KNN algorithm?

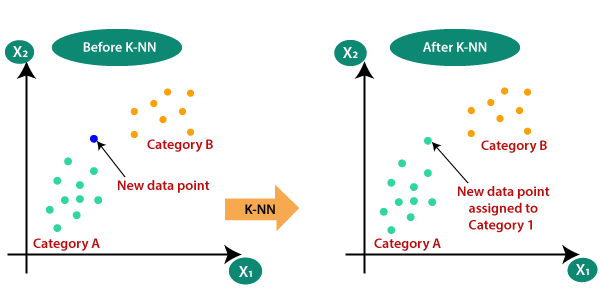
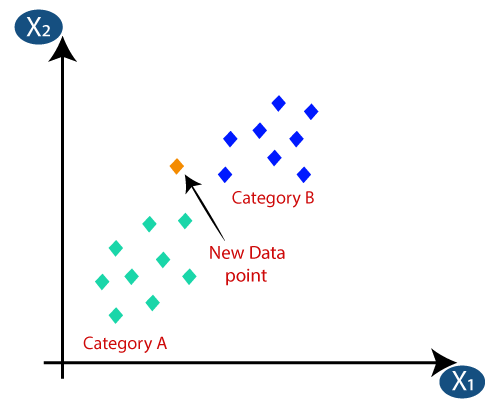
Suppose there are two categories, i.e., Category A and Category B, and we have a new data point x1, so this data point will lie in which of these categories. To solve this type of problem, we need a K-NN algorithm. With the help of K-NN, we can easily identify the category or class of a particular dataset. Consider the below diagram:

How does K-NN work?

To implement KNN algorithm you need to follow following steps.

  • Step-1: Select the number K of the neighbors
  • Step-2: Calculate the Euclidean distance of K number of neighbors
  • Step-3: Take the K nearest neighbors as per the calculated Euclidean distance.
  • Step-4: Among these k neighbors, count the number of the data points in each category.
  • Step-5: Assign the new data points to that category for which the number of the neighbor is maximum.
  • Step-6: Our model is ready.

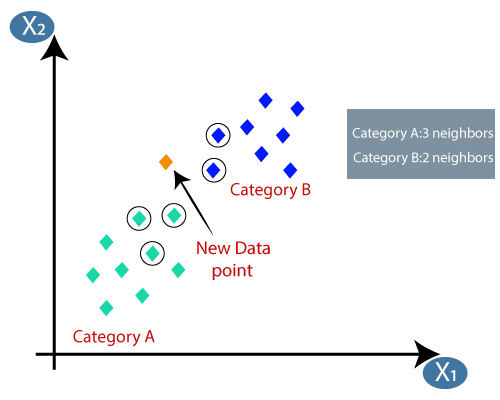
Suppose we have a new data point and we need to put it in the required category. Consider the below image:

  • First of all, we will choose the number of neighbors, so we will choose the k=5.
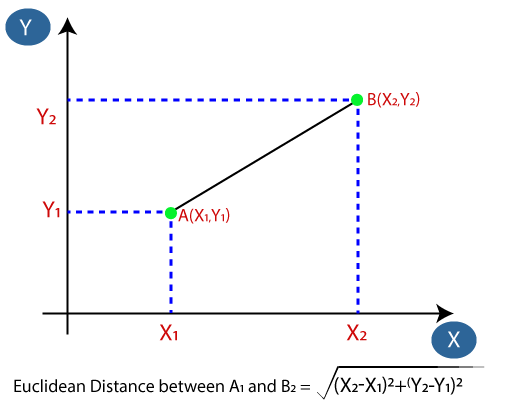
  • Next, we will calculate the Euclidean distance between the data points. The Euclidean distance is the distance between two points, which we have already studied in geometry. It can be calculated as:

By calculating the Euclidean distance we got the nearest neighbors, as three nearest neighbors in category A and two nearest neighbors in category B. Consider the below image:

  • As we can see the 3 nearest neighbors are from category A, hence this new data point must belong to category A.

How to select the value of K in the K-NN Algorithm?

Below are some points to remember while selecting the value of K in the K-NN algorithm:

  • There is no particular way to determine the best value for “K”, so we need to try some values to find the best out of them. The most preferred value for K is 5.
  • A very low value for K such as K=1 or K=2, can be noisy and lead to the effects of outliers in the model.
  • Large values for K are good, but it may find some difficulties.

Pros and Cons of KNN:

Pros-

  • Very Simple
  • Training is trivial
  • Works with any number of classes
  • Easy to add more data
  • It has few parameter such as K and distance matric.

Cons-

  • The computation cost is high because of calculating the distance between the data points for all the training samples.
  • Categorical features don’t work well
  • Not good with the high dimensional data

Reference-

Javapoint

Naïve Bayes Classifier-Theory

What is a classifier?

A classifier is a machine learning model that is used to discriminate different objects based on certain features.

Principle of Naive Bayes Classifier:

  • Naïve Bayes algorithm is a supervised learning algorithm, which is based on Bayes theorem and used for solving classification problems.
  • It is mainly used in text classification that includes a high-dimensional training dataset.
  • Naïve Bayes Classifier is one of the simple and most effective Classification algorithms which helps in building the fast machine learning models that can make quick predictions.
  • It is a probabilistic classifier, which means it predicts on the basis of the probability of an object.
  • Some popular examples of Naïve Bayes Algorithm are spam filtration, Sentimental analysis, and classifying articles.

Why is it called Naïve Bayes?

The Naïve Bayes algorithm is comprised of two words Naïve and Bayes, Which can be described as:

  • Naïve: It is called Naïve because it assumes that the occurrence of a certain feature is independent of the occurrence of other features. Such as if the fruit is identified on the bases of color, shape, and taste, then red, spherical, and sweet fruit is recognized as an apple. Hence each feature individually contributes to identify that it is an apple without depending on each other.
  • Bayes: It is called Bayes because it depends on the principle of Bayes Theorem.

Bayes Theorem:

  • Bayes’ theorem is also known as Bayes’ Rule or Bayes’ law, which is used to determine the probability of a hypothesis with prior knowledge. It depends on the conditional probability.
  • The formula for Bayes’ theorem is given as:

Where,

P(A|B) is Posterior probability: Probability of hypothesis A on the observed event B.

P(B|A) is Likelihood probability: Probability of the evidence given that the probability of a hypothesis is true.

P(A) is Prior Probability: Probability of hypothesis before observing the evidence.P(B) is Marginal Probability: Probability of Evidence.

Working of Naïve Bayes Classifier:

Working of Naïve Bayes’ Classifier can be understood with the help of the below example:

Suppose we have a dataset of weather conditions and corresponding target variable “Play“. So using this dataset we need to decide that whether we should play or not on a particular day according to the weather conditions. So to solve this problem, we need to follow the below steps:

  1. Convert the given dataset into frequency tables.
  2. Generate Likelihood table by finding the probabilities of given features.
  3. Now use Bayes theorem to calculate the posterior probability.

Problem: If the weather is sunny, then the Player should play or not?

Solution: To solve this, first consider the below dataset:

Outlook   Play
0 Rainy Yes
1 Sunny Yes
2 Overcast Yes
3 Overcast No
4 Sunny Yes
5 Rainy Yes
6 Sunny Yes
7 Overcast No
8 Rainy No
9 Sunny Yes
10 Sunny No
11 Rainy Yes
12 Overcast Yes
13 Overcast  

Frequency table for the Weather Conditions:

Weather Yes No
Overcast 5 0
Rainy 2 2
Sunny 3 2
Total 10 5

Likelihood table weather condition:

Weather No Yes
Overcast 0 5 5/14= 0.35
Rainy 2 2 4/14=0.29
Sunny 2 3 5/14=0.35
All 4/14=0.29 10/14=0.71

Applying Bayes theorem:

P(Yes|Sunny)= P(Sunny|Yes)*P(Yes)/P(Sunny)

P(Sunny|Yes)= 3/10= 0.3

P(Sunny)= 0.35

P(Yes)=0.71

So P(Yes|Sunny) = 0.3*0.71/0.35= 0.60

P(No|Sunny)= P(Sunny|No)*P(No)/P(Sunny)

P(Sunny|NO)= 2/4=0.5

P(No)= 0.29

P(Sunny)= 0.35

So P(No|Sunny)= 0.5*0.29/0.35 = 0.41

So as we can see from the above calculation that P(Yes|Sunny)>P(No|Sunny)

Hence on a Sunny day, Player can play the game.

Advantages of Naïve Bayes Classifier:

  • Naïve Bayes is one of the fast and easy ML algorithms to predict a class of datasets.
  • It can be used for Binary as well as Multi-class Classifications.
  • It performs well in Multi-class predictions as compared to the other Algorithms.
  • It is the most popular choice for text classification problems.

Disadvantages of Naïve Bayes Classifier:

  • Naive Bayes assumes that all features are independent or unrelated, so it cannot learn the relationship between features.

Applications of Naïve Bayes Classifier:

  • It is used for Credit Scoring.
  • It is used in medical data classification.
  • It can be used in real-time predictions because Naïve Bayes Classifier is an eager learner.
  • It is used in Text classification such as Spam filtering and Sentiment analysis.

Types of Naïve Bayes Model:

There are three types of Naive Bayes Model, which are given below:

  • Gaussian: When the predictors take up a continuous value and are not discrete, we assume that these values are sampled from a gaussian distribution.
  • Multinomial: The Multinomial Naïve Bayes classifier is used when the data is multinomial distributed. It is primarily used for document classification problems, it means a particular document belongs to which category such as Sports, Politics, education, etc.The classifier uses the frequency of words for the predictors.
  • Bernoulli: The Bernoulli classifier works similar to the Multinomial classifier, but the predictor variables are the independent Booleans variables. Such as if a particular word is present or not in a document. This model is also famous for document classification tasks.

Reference:-

Javapoint

Support Vector machine-Theory

Support Vector Machine or SVM is one of the most popular Supervised Learning algorithms, which is used for Classification as well as Regression problems. However, primarily, it is used for Classification problems in Machine Learning.

The goal of the SVM algorithm is to create the best line or decision boundary that can segregate n-dimensional space into classes so that we can easily put the new data point in the correct category in the future. This best decision boundary is called a hyperplane.

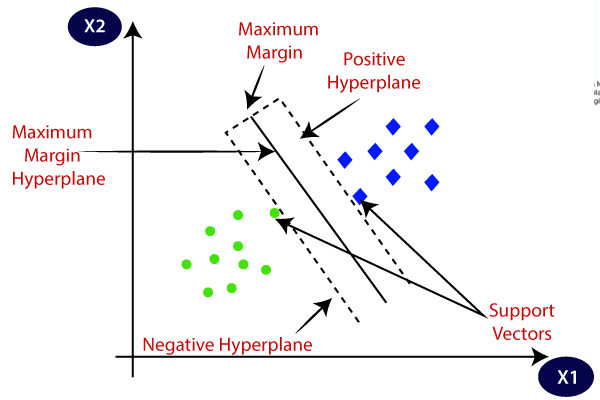
SVM chooses the extreme points/vectors that help in creating the hyperplane. These extreme cases are called as support vectors, and hence algorithm is termed as Support Vector Machine. Consider the below diagram in which there are two different categories that are classified using a decision boundary or hyperplane:

Let’s understand SVM through an example.

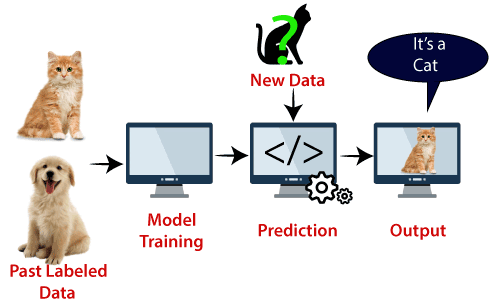
Suppose we see a strange cat that also has some features of dogs, so if we want a model that can accurately identify whether it is a cat or dog, so such a model can be created by using the SVM algorithm. We will first train our model with lots of images of cats and dogs so that it can learn about different features of cats and dogs, and then we test it with this strange creature. So as support vector creates a decision boundary between these two data (cat and dog) and choose extreme cases (support vectors), it will see the extreme case of cat and dog. On the basis of the support vectors, it will classify it as a cat. Consider the below diagram:

SVM algorithm can be used for Face detection, image classification, text categorization, etc.

Types of SVM:

SVM can be of two types:

  • Linear SVM: Linear SVM is used for linearly separable data, which means if a dataset can be classified into two classes by using a single straight line, then such data is termed as linearly separable data, and classifier is used called as Linear SVM classifier.
  • Non-linear SVM: Non-Linear SVM is used for non-linearly separated data, which means if a dataset cannot be classified by using a straight line, then such data is termed as non-linear data and classifier used is called as Non-linear SVM classifier.

Hyperplane and Support Vectors in the SVM algorithm:

Hyperplane: There can be multiple lines/decision boundaries to segregate the classes in n-dimensional space, but we need to find out the best decision boundary that helps to classify the data points. This best boundary is known as the hyperplane of SVM.

The dimensions of the hyperplane depend on the features present in the dataset, which means if there are 2 features (as shown in image), then hyperplane will be a straight line. And if there are 3 features, then hyperplane will be a 2-dimension plane.

We always create a hyperplane that has a maximum margin, which means the maximum distance between the data points.

How does SVM works?

Linear SVM:

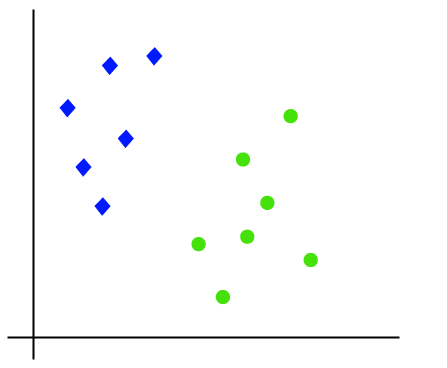
The working of the SVM algorithm can be understood by using an example. Suppose we have a dataset that has two tags (green and blue), and the dataset has two features x1 and x2. We want a classifier that can classify the pair(x1, x2) of coordinates in either green or blue. Consider the below image:

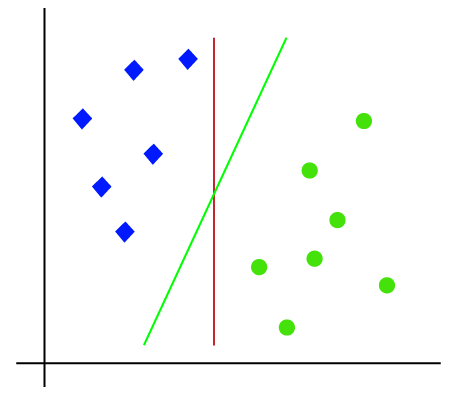
So as it is 2-d space so by just using a straight line, we can easily separate these two classes. But there can be multiple lines that can separate these classes. Consider the below image:

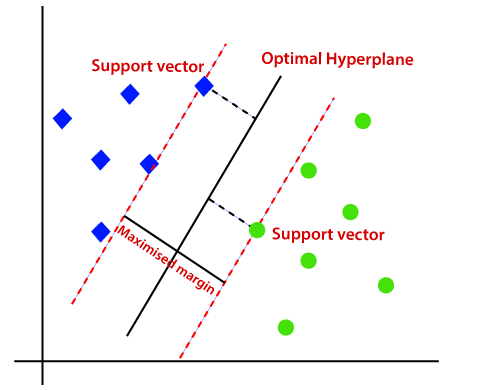
Hence, the SVM algorithm helps to find the best line or decision boundary; this best boundary or region is called as a hyperplane. SVM algorithm finds the closest point of the lines from both the classes. These points are called support vectors. The distance between the vectors and the hyperplane is called as margin. And the goal of SVM is to maximize this margin. The hyperplane with maximum margin is called the optimal hyperplane.

Non-Linear SVM:

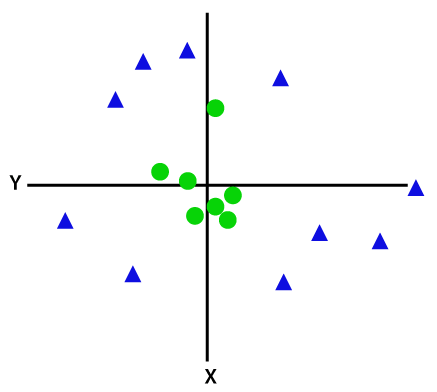
If data is linearly arranged, then we can separate it by using a straight line, but for non-linear data, we cannot draw a single straight line. Consider the below image:

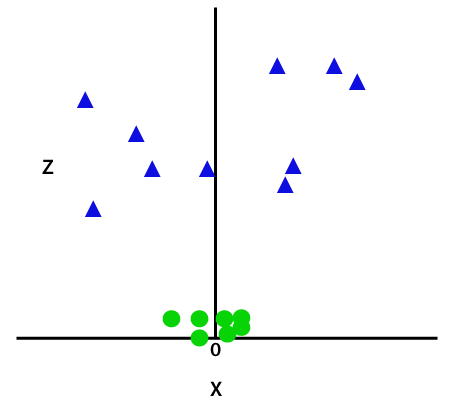
So to separate these data points, we need to add one more dimension. For linear data, we have used two dimensions x and y, so for non-linear data, we will add a third dimension z. It can be calculated as:

z=x2 +y2

By adding the third dimension, the sample space will become as below image:

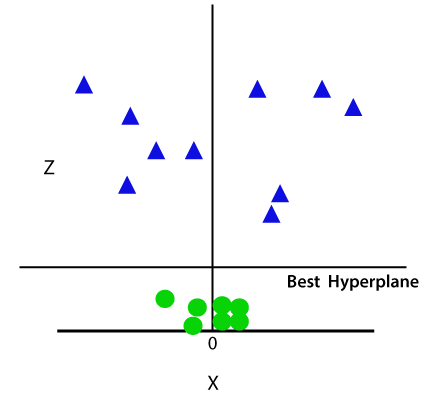
So now, SVM will divide the datasets into classes in the following way. Consider the below image:

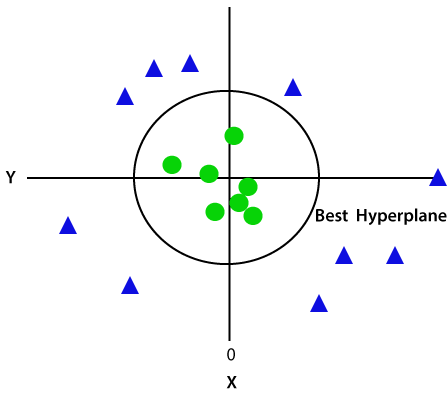
Since we are in 3-d Space, hence it is looking like a plane parallel to the x-axis. If we convert it in 2d space with z=1, then it will become as:

Hence we get a circumference of radius 1 in case of non-linear data.

We will see Python Implementation of Support Vector Machine in next chapter

Reference-

Javapoint